Operations | Monitoring | ITSM | DevOps | Cloud

Monitoring

The latest News and Information on Monitoring for Websites, Applications, APIs, Infrastructure, and other technologies.

Modern Observability 101

In technology, having “modern” capabilities is standard. Staying ahead of the curve is critical, and keeping outdated technology or processes going can be a recipe for disaster in a complex, ever-changing landscape. Ensuring the smooth functioning and performance of software systems is paramount. This is where modern observability—a sophisticated approach to monitoring and understanding the inner workings of applications and infrastructure—is required.

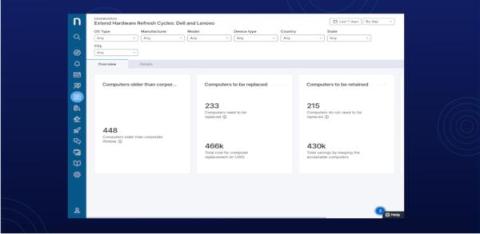
How To Perform A Usage Based Intelligent Hardware Refresh With Nexthink

Today’s evolving technology makes it imperative for you to refresh or update organization’s hardware and software. This will decrease downtime, prevent crashes while increasing employee productivity. Nexthink combines employee usage, sentiment and performance data to help you make informed hardware refresh decisions that fit the needs of your employees and the business overall. Let's see how Nexthink performs a usage based intelligent hardware refresh.

NetFlow Analyzers: Definitions, Key Features & Use Cases

Imagine your company’s network is like a busy city’s road system. Just like roads have traffic moving back and forth, your network has data packets traveling to and from destinations. But when the roads get too crowded, or a suspicious vehicle makes its way onto the highway, it can cause traffic jams and security incidents that impact the organization. That’s where NetFlow analyzers come in. In this article, we’ll break down the basics of NetFlow analyzers.

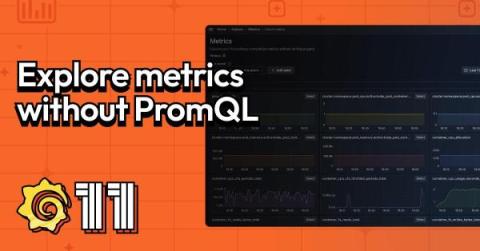
How to explore metrics without PromQL queries in Grafana

At GrafanaCON 2024, Grafana founder Torkel Ödegaard introduced Grafana 11, which has a feature set that aligns with the same goals we’ve had since the OSS project launched in 2013. “The core mission of Grafana that we’ve had from the start is to make observability easy and powerful through good UX design, a focus on ease of use, and user flexibility and freedom,” Torkel said.

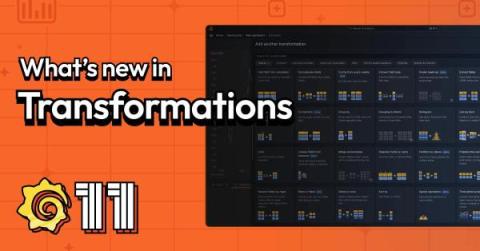
Grafana transformations: 10 new ways to get more out of your data

One of the superpowers of Grafana is the ability to bring all of your data into a single platform thanks to our rich catalog of data sources. Oftentimes you will want to visualize information from disparate data sources together in a single dashboard or panel. Or you might want to refine data returned from queries without altering the original data source. Or you may need to modify data due to limitations of a query language that stops you from getting the required formatting.

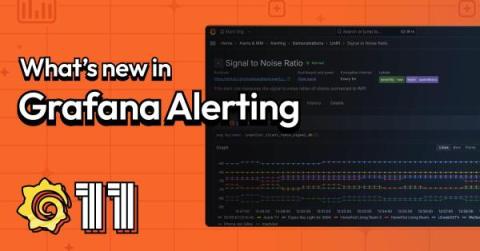
Grafana Alerting: new tools to resolve incidents faster and avoid alert fatigue

The maturity of your alerting strategy has a direct impact on the reliability of your infrastructure and your applications. It can also have a big impact on engineering productivity. So whether you’re talking about resolving incidents faster or avoiding alerting fatigue, alerting should always be front and center.

Empowering Engineering Excellence: Achieving a 26% Reduction in On-call Pages at Amperity with Modern Observability for Logs

Amperity required an observability partner to facilitate their transition into the modern engineering era as their previous tooling struggled to support their growth strategy. When customer data is scattered everywhere, how do you put the pieces together to get an accurate customer 360° view? That’s the power of Amperity’s customer data platform (CDP), and the company has been driving customer data innovation for nearly a decade.