Operations | Monitoring | ITSM | DevOps | Cloud

The latest News and Information on Monitoring for Websites, Applications, APIs, Infrastructure, and other technologies.

We've done it again: ManageEngine named a 2023 Gartner Peer Insights Customers' Choice for Application Performance Monitoring and Observability!

At ManageEngine, customers are at the heart of everything we do. That’s why we are excited to be recognized as a 2023 Gartner Peer Insights™ Customers’ Choice for Application Performance Monitoring and Observability. This year marks the fifth time we have been recognized with this distinction.

Microsoft Azure Monitor SCOM MI GA | What's New

Azure Monitor SCOM Managed Instance (MI) General Availability (GA) is a powerful integration that bridges the gap between Azure Monitor and System Center Operations Manager (SCOM). This release marks the culmination of efforts to enhance monitoring capabilities, offering users a seamless experience by combining the robust functionalities of SCOM with the agility and scalability of Azure Monitor. By leveraging this integration, organizations gain comprehensive insights, improved efficiency, and greater control over their hybrid environments, ensuring enhanced performance and reliability across their infrastructure.

Decoding PostgreSQL Monitoring | 101 Guide

Monitoring PostgreSQL for performance issues is critical. PostgreSQL is a powerful open-source relational database system that stands out for its robustness, scalability, and strong emphasis on extensibility and standards compliance. In this guide on PostgreSQL monitoring, we will cover key PostgreSQL metrics that should be monitored, best practices for monitoring PostgreSQL and some tools with which you can set up PostgreSQL monitoring.

Debugging weird stack traces with Session Replay

Imagine this: Your website is getting a lot of traffic and you have some kind of metrics, logging, or performance monitoring setup (maybe even Sentry). You’re alerted to something… odd. You open up your error and see that a request was interrupted by another request. Uh oh. This sounds like a user was rage-clicking , clicking like crazy making duplicate requests. You weren’t expecting that!

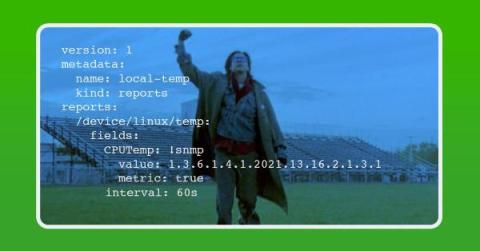
Analyze Your Mailchimp Campaigns Using Telegraf

Monitoring your email campaigns helps you track key performance indicators (KPIs) such as open rates, click-through rates, and conversion rates. This evaluation provides insights into the success of your email campaigns and allows you to identify areas for improvement and by analyzing metrics like open rates and click-through rates, you can gauge the level of engagement your emails are generating.

Managing Telemetry Data Overflow in Kubernetes with Resource Quotas and Limits

One of the inherent challenges you'll face when working with Kubernetes is that a typical cluster includes many resources that produce telemetry data. Because producing and moving telemetry data consumes resources, you can end up in situations where different workloads are competing for the resources necessary to manage telemetry data.

Understand & Optimize Your Telemetry Data (Subtitled)

The explosion of telemetry data also massively increases your data bill. Teams also cannot control the data they do not understand and often lack the capabilities to act on it once it is understood. Mezmo makes it easier to understand and optimize your data. It helps reduce unnecessary noise and cost, and improve the quality of your data, so that your developers and engineers can consistently deliver on their service level objectives.

5 Cloud Outages Tracker Tools To Monitor Vendors in 2024

Whether you’re a business owner, a tech enthusiast, or simply a user who relies on cloud services for daily tasks, the cloud outage tracker can be a useful tool. It informs you of downtime, degraded performance, and maintenance of services that modern businesses rely on. Here’s the list of cloud outage tracker tools that can help you prepare for and mitigate the effects of inevitable disruptions in the cloud.

Partitioning Data for Query Performance in InfluxDB 3.0

Query performance is critical in any database. Data partitioning is a mechanism that helps prune unnecessary data, allowing queries to run faster. However, there are always trade-offs between large and small numbers of partitions. For instance, fine-grained partitioning on high cardinality columns can reduce performance. This post describes different partitioning schemes supported by InfluxDB 3.0 and explains their trade-offs.