The latest News and Information on Monitoring for Websites, Applications, APIs, Infrastructure, and other technologies.
Recently, I was talking to Catchpoint’s High School Summer Interns about what software engineering is all about. They’re spending a week at a time with various Catchpoint departments, and last week was with the Catchpoint Technology Group.
MongoDB is one of the most popular NoSQL databases in the world, used by millions of developers to store application metrics from e-commerce transactions to user logins. The MongoDB Enterprise plugin for Grafana — which is available for users with a Grafana Cloud account or with a Grafana Enterprise license — unlocks all of the data stored in MongoDB as well as diagnostic metrics for monitoring MongoDB itself for visualization, exploration, and alerting.
This is the second post in a 2 part blog series on debugging, monitoring and tracing NodeJS Lambda applications. If you haven’t yet seen part 1, check it out here (it’s a great read!) Now let’s get back into our post with one of the most commonly experienced issues when it comes to Lambda functions, Cold Starts.
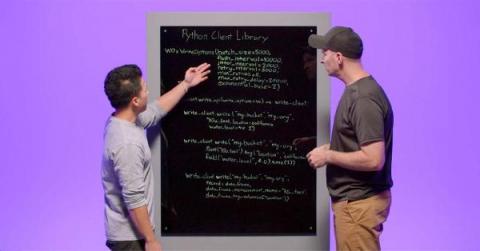
InfluxDB has over a dozen different client libraries to help developers work with time series data in whatever programming language they like best. The Python client library is one of our most popular options. It’s simple to learn, and working with InfluxDB in a language you’re comfortable with helps you get started doing powerful time series analysis quickly.
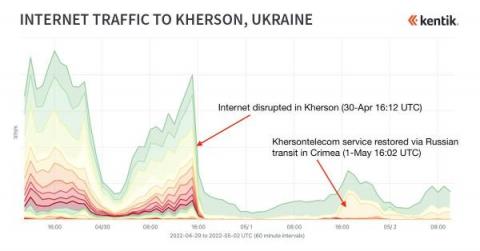
Since the beginning of June this year, internet connectivity in the Russian-held Ukrainian city of Kherson has been rerouted through Crimea, the peninsula in southern Ukraine that has been occupied by Russia since March 2014. As I explain in this blog post, the rerouting of internet service in Kherson appears to parallel what took place following the Russian annexation of the Crimean peninsula.
Telemetry data is a powerful tool for understanding the behavior of complex systems. OpenTelemetry provides a platform-agnostic, open-source way to collect, process, and store telemetry data. This post explores the OpenTelemetry collector architecture, specifically focusing on the Collectors component. We'll look at how collectors work and how they can be used to process telemetry data from any system or application. We'll also discuss some benefits of using OpenTelemetry for your telemetry needs.
By combining traffic replay capabilities from Speedscale with observability from Datadog, SRE Teams can deploy with confidence. It makes sense to centralize your monitoring data into as few silos as possible. With this integration, Speedscale will push the results of various traffic replay conditions into Datadog so it can be combined with the other observability data. Being able to preview application performance by simulating production conditions allows better release decisions. Moreover, a baseline to compare production metrics can provide even earlier signals on degradation and scale problems. Speedscale joined the Datadog Marketplace so customers can shift-left the discovery of performance issues.