Operations | Monitoring | ITSM | DevOps | Cloud

The latest News and Information on Monitoring for Websites, Applications, APIs, Infrastructure, and other technologies.

Monitoring and Securing Cloud-Based Databases Is the Developer's Responsibility

Modern application development requires more work to ensure the development path and the data it produces are fully in sync, secure, optimized, and error-free. This responsibility has increasingly fallen upon application developers. They’re being asked to double as database administrators to maintain fluidity in the process and support an agency’s rapid release cycle.


DNS Monitoring 101 - Troubleshoot Anycast DNS Issues

Today’s Tip of the Day is the final of three focused on Domain Name System (DNS) monitoring. In the rest of the series, we looked at how digital experience monitoring (DEM) can (i) help ensure users are served by the correct DNS server to reduce latency and (ii) help to guard against DNS-related attacks. In today’s post, we talk about Anycast DNS, the advantages it provides, the challenges it presents in relation to troubleshooting DNS issues, and how to overcome them with Catchpoint.

Service monitoring and availability made simple with Elastic Uptime and Heartbeat

In the world of IT, availability can mean a lot of things. Your website is available if it is up, responding in a timely manner, sending the correct headers, and serving a valid certificate. Your network is available if the correct hosts are online, responding to ICMP pings, and responding to TCP requests on specific ports. Your API endpoint is available if it returns the correct values when sent specific requests.

The Cloud - A sellers' perspective on a hot topic.

I have worked at Virtana for nearly 9 years. During that time, I have had the pleasure to interact with customers, prospects, and partners around the world. The types of conversations I have participated in have dramatically shifted during that time. Back in September 2011, the dialogues were largely focused on Storage Area Network (SAN) infrastructure, and how Virtana could provide performance assurances targeted at this environment. Over time, the conversations have broadened dramatically.

Sumo Logic Achieves FedRAMP-Moderate "In Process"

Sumo Logic is taking the next step towards Moderate authorization under the Federal Risk and Authorization Management Program (FedRAMP). Today Sumo moved from “Ready” to “In Process” on the FedRAMP Marketplace, an important step toward expanding our ability to serve U.S. governmental agencies. Sumo Logic expects to achieve FedRAMP-Moderate Authorization quickly while working closely with the Federal Trade Commission (FTC) as our agency partner.

Through the Crisis: Nexthink Customer Stories (Bournemouth University)

Across almost all industries, IT’s focus has shifted from WFH (Work From Home) to WFA (Work From Anywhere). Some businesses and organizations might be further along in facilitating flexible work, but it seems like everybody is instinctively starting to rethink both their short and long term management strategies.

How to Use Starlark with Telegraf

Our Telegraf Starlark Processor Plugin is an exciting new processor in Telegraf 1.15 that gives you the flexibility of performing various operations in Telegraf using the Starlark language. What is Starlark, you ask? Starlark (formerly known as Skylark) is a language intended for use as a configuration language. Starlark is a dialect of Python. Like Python, it is a dynamically typed language with high-level data types, first-class functions with lexical scope, and garbage collection.

New in Telegraf 1.15: Starlark, execd, Go, NGINX, Network Monitoring, Redfish, New Relic, MongoDB and More

Last week we released Telegraf 1.15 with new plugins for network monitoring and a large number of processors to help with your data ingestion. All packages were written in Go 1.14.5. This all couldn’t have been done without the 50+ community members who contributed to writing plugins, fixing bugs, reviewing code, and everything else to help make Telegraf better! Here’s a quick look into new plugins and features we launched in Telegraf 1.15.

Java Logging Best Practices: 10+ Tips You Should Know to Get the Most Out of Your Logs

Having visibility into your Java application is crucial for understanding how it works right now, how it worked some time in the past and increasing your understanding of how it might work in the future. More often than not, analyzing logs is the fastest way to detect what went wrong, thus making logging in Java critical to ensuring the performance and health of your app, as well as minimizing and reducing any downtime.

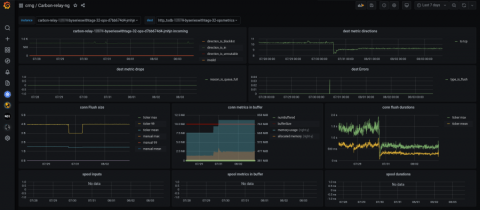
How to stream Graphite metrics to Grafana Cloud using carbon-relay-ng

In this post we’ll show how you can easily ship your existing Graphite metrics to Grafana’s managed metric offering using carbon-relay-ng. Carbon-relay-ng is a fast, go-based carbon-relay replacement that allows you to easily aggregate, filter and route your Graphite metrics. This post assumes you have a local carbon-relay-ng binary. You can download carbon-relay-ng binaries from the releases page and find documentation on Docker images, Linux packages, and how to build it yourself here.