Webinar: The Who, What & Why of Commercial Open Source
We've assembled a panel of experts that have a close relationship with open source to discuss bridging the gap between free, open-source software and commercial open-source products.


The latest News and Information on DevOps, CI/CD, Automation and related technologies.
We spoke with two members from the SRE team, Alex Blyth and Zulhilmi Zainudin, to learn more about their role at Civo. Through this series, we aim to provide you with an overview of the different roles we have at Civo and what advice our team has. You can discover more about our team in our “day in the life of a Go Dev” and “day in the life of an Intern” blog.
Before I dive into the launch of Cycle’s latest feature (and it’s a big one!) I want to share some context about how we got here. Let’s rewind back to 2015: containers, at least in their modern form, had just begun to take the developer ecosystem by storm. At the same time, we at Cycle were watching everything unfold: from Docker’s meteoric rise to the first few releases of tools like Kubernetes, Rancher, and so on.
Most engineering teams are no strangers to key performance indicators (KPIs), those metrics tracking progress toward critical goals and targets. Ideally, tech leaders design KPIs to focus teams on what matters and prove their contribution to the company’s overall performance. Of course, KPI data should also uncover critical information that guides informed decision-making. For engineering teams tasked with managing the customer experience, KPIs often track availability.
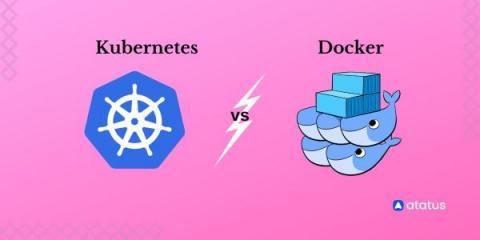
Docker is a PaaS product, developed by Docker.Inc to containerize applications. It does so by combining app source code with OS libraries and dependencies required to run that code in any environment. Kubernetes is a similar tool developed by Google, which scales up this containerized application after deployment. While one works in building the containers the other essentially helps in scaling it up, then why so much buzz around these two?
Designing a production service environment around Apache Kafka that delivers low latency and zero-data loss at scale is non-trivial. Indeed, it’s the holy grail of messaging systems. In this blog post, I’ll outline some of the fundamental service design considerations that you’ll need to take into account in order to get your service architecture to measure up. Let’s start with the basics.