Operations | Monitoring | ITSM | DevOps | Cloud

The Place Where Modern Operations & Technology Come Together

What is the Grafana Knowledge Graph and How Does It Help AI Agents? (Demo)
Grafana's Knowledge Graph builds a contextual layer on top of your telemetry data, automatically extracting entities and relationships so you can see how your services actually connect. In this deep dive, Jia show how it powers root-cause investigation both in the Grafana UI and through agentic workflows using gcx and Claude Code. Learn more about Grafana's observability tools and try Knowledge Graph for your own telemetry data at grafana.com.

The new APM experience: every service monitored from day one, and ready for your AI agent
Coralogix APM has told you which service is behind the latency. From today, the new APM experience tells you what is behind the service: the release, the environment, or the query one layer down. It watches every service you run from the moment it appears, without anyone writing an alert. And everything you see on the screen, your AI agent can use too: in Olly, from the Coralogix CLI, or through MCP in your IDE. A latency chart shows that something got slow.
CriblCon 2026 Keynote: The AI Platform for Telemetry
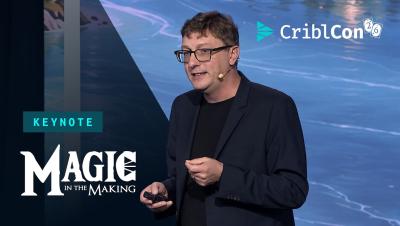
In this CriblCon 2026 keynote, Cribl leaders introduce the AI Platform for Telemetry and explain how organizations can own, search, govern, and use telemetry for both human investigators and AI agents. The keynote is for teams responsible for security, observability, IT operations, and telemetry infrastructure.
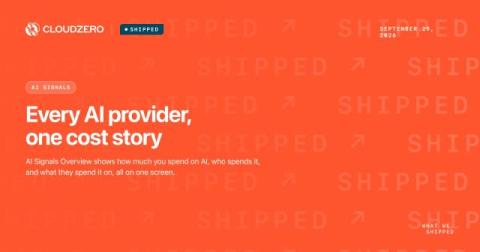
Shipped: Every AI provider, one cost story
If you were anywhere near LinkedIn last week, you probably saw us launch AI Signals. We weren’t exactly quiet about it. (Press release, a couple of blog posts, and more social posts than we’d like to admit. Sorry about your feed.) We covered the why behind AI Signals already, but I wanted to actually walk you through what you’re seeing on the screen. Sooner or later someone asks what the company spent on AI last month.
Map a Service in Your CMDB With AI Suggestions
See how to create a Business Application in InvGate Asset Management and map the Configuration Items (CIs) behind any service using AI-powered relationship suggestions. Add one CI, let the system suggest what connects to it, and apply the suggestions to build your map in a couple of clicks. It also identifies the type of each relationship, so the map reflects how your infrastructure actually works.
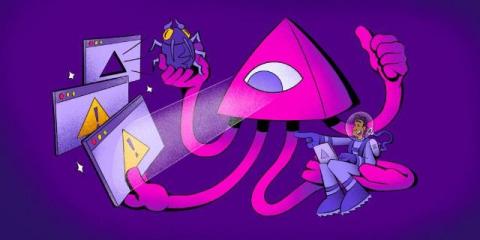
Big improvements to Seer Agent
Today marks exactly five months since we launched Seer Agent, our friendly AI agent for querying all things in your Sentry projects (well, five months and a day ago, but close enough). Since then, we’ve had a lot of chats with Seer Agent. You may have even seen a few of them popping up on social media recently. It’s become an integral part of our debugging workflows and feature iteration process.
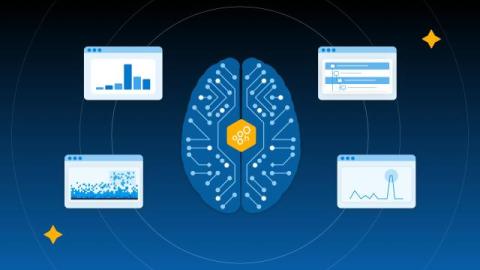
Agents Need Context: Introducing Canvas Connectors, Fleet-wide AI Agent Visibility, and More
Earlier this year, we introduced more capabilities to support agents in production, a more chaotic, complex environment that requires a tremendous amount of context to understand. Unlike tools that capture shallow, pre-aggregated metrics, or cannot join a metric, trace, and log in one query, Honeycomb retains the context and connective tissue from telemetry data to build a nuanced view of production.
Introducing AI Ecosystem: Zoom Out to See Your Whole AI Agent Fleet
A few months ago, we launched Agent Timeline to close the gap between knowing an agent failed and understanding why. It took the tangled reality of a multi-agent, multi-trace workflow and rendered it as a single, readable conversation: every LLM call, tool invocation, handoff, and downstream system span laid out in the order they happened.