Operations | Monitoring | ITSM | DevOps | Cloud

The latest News and Information on Monitoring for Websites, Applications, APIs, Infrastructure, and other technologies.

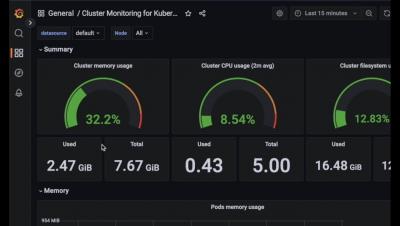
Prometheus Query Tutorial with examples

Monitoring tools are only as good as the range and visibility they offer admins into applications’ performance. Prometheus is a metrics monitoring tool that provides a pull-based system to collect and monitor time-series samples. Once the data is collected and stored, you can use Prometheus Queries to interact with the data: select and aggregate across the provided dimensions. This article takes the reader from concept to content state about the Prometheus Query language.

Postcard From .conf22: Customers Inspire Our Latest Release

They say, “What happens in Vegas, stays in Vegas,” but I wanted to highlight the role our customers played at last month’s.conf22, our annual users’ event at the MGM Grand. It was awesome meeting customers in person again, and connecting virtually with thousands more. We had a terrific turnout with 8,200+ customers and partners representing 113 countries and more than 6,500 organizations.

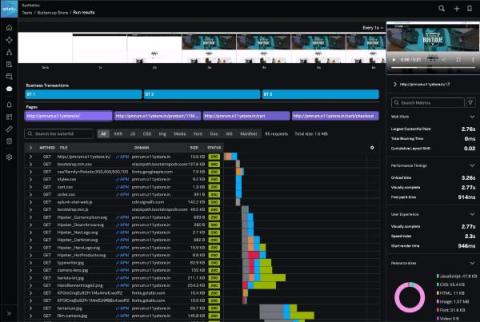
Announcing the General Availability of Synthetic Monitoring Within Splunk Observability

Today we’re proud to announce the general availability of best-in-class Synthetic Monitoring capabilities within Splunk Observability Cloud. Now, IT and engineering teams can proactively measure, monitor and troubleshoot their critical user flows, APIs and services, connected across Splunk Observability.

What Is Helm in Kubernetes?

Helm is a deployment tool that simplifies installing, configuring, and managing Kubernetes clusters. Anyone familiar with writing Kubernetes manifests knows how tedious it is to create multiple manifest files using YAML. Even the most basic application has at least 3 manifest files. As the cluster grows, the more unwieldy the configuration becomes. Helm is one of the most useful tools in a developer’s tool belt for managing Kubernetes clusters.

Nexthink Named a Leader in Forrester Wave Report!

We’ve got exciting news: The Forrester Wave™: End-User Experience Management, Q3 2022 report has been released – and Nexthink has been named a leader in End-User Experience Management! In case you’re unfamiliar, this report provides a comprehensive evaluation of the nine most significant end-user experience management (EUEM) providers by one of the world’s leading research and advisory firms.

Grafana Alerting video: How to create alerts in Grafana 9

With the Grafana 9.0 release, we rolled out the new and improved Grafana Alerting experience, which is now the default alerting system across all of our products. Along with introducing significant improvements to Grafana Alerting based on community feedback and more robust alerting documentation to guide our users, we also created easy-to-follow video tutorials to help you get started with creating alerts.

Sponsored Post

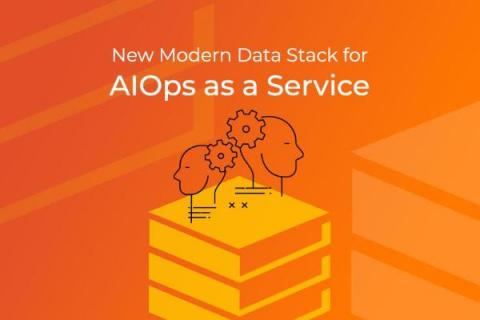
New Modern Data Stack for AIOps as a Service

Data laying all around an enterprise’s premises and over the cloud is of no use unless it forms part of a bigger and clearer picture. This is what a data stack does by helping enterprises leverage data to its fullest potential- it turns raw data into insights that can be acted on and lead to business benefits. The complicated modern enterprise of today cannot make do anymore with the obsolete ways of data management.

Importance and Tips of Condition-Based Monitoring Maintenance

Usually, maintenance is performed based on two factors first is when asset failure has occurred and second is scheduled maintenance. In both cases, asset maintenance is done when the asset is in good condition or when it is too late. This is where condition-based monitoring maintenance comes into play. This maintenance is proactive, and maintenance is given to assets when it is required. For this purpose, assets are inspected regularly, several asset tracking techniques are used such as IoT.

Cribl.Cloud Simplified with Consumption Pricing

One year ago, we launched Cribl.Cloud as a cloud-hosted option for our industry-leading data pipeline product, Cribl Stream. Customers had a choice of either deploying on-premises with a subscription-based tiered license model or opting for our cloud service with a similar tiered billing model. Fast-forward one year, and Cribl is now a multi-product company with several unique observability products (Stream, Edge, AppScope, and soon Search) to offer our customers.