Operational monitoring can be like looking down the wrong end of a telescope. There’s no clear picture of the horizon. Everything is blurred, indistinct, and difficult to trace. If you’re relying on traditional, domain-centric monitoring, you’re faced with a similar problem: you can see the performance of individual elements, but you don’t have any visibility into the broader picture.
In one of our preceding blogs, we spoke about Software-Defined Networking (SDN) and the key drivers behind it. Virtualisation is one of the fundamental aspects that characterises SDN, and has influenced the architecture of network switching in the data centre. OVS (Open vSwitch) is a fundamental component of modern and open data centre SDNs, where it aggregates all the virtual machines at the server hypervisor layer.
We’re excited to announce the launch of private network integrations! This lets you use our existing Status Checks and Webhooks features on systems residing inside of your internal network, empowering any Gremlin team to automate Gremlin tasks safely and securely.

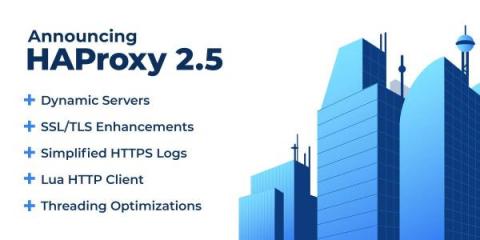
Register for our live webinar to learn more about this release. HAProxy 2.5 is now available! It adds improvements to a number of areas including better usability around setting variables, more descriptive error reporting and logging, and enhanced HTTP and WebSocket support. The HAProxy Runtime API has expanded its coverage of SSL-related commands and now includes the ability to add and remove CA files and revocation lists on-the-fly.
A single Kubernetes cluster expends a small percentage of its total available assigned resources on delivering in-cluster networking. We don’t have to be satisfied with this, though—achieving the lowest possible overhead can provide significant cost savings and performance improvements if you are running network-intensive workloads.
Obkio announces a new Monitoring Agent operated by R2i, a leading Canadian provider of Cloud Computing Managed Services, Data Centre Solutions and Artificial Intelligence solutions. Learn how R2i’s new Obkio Monitoring Agent will allow them to offer their customers a complete network and cloud monitoring solution for fast support.
Forty percent of enterprises say an hourly network outage costs up to $1 million. Evidently, one minor overlook in monitoring the performance and availability of a network can result in costly downtime. This is why firms that heavily rely on network operations should perform dynamic network monitoring to keep their network protected from unexpected downtime.
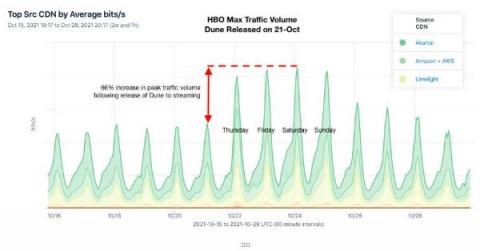
Last month, the long-awaited film adaptation of Frank Herbert’s sci-fi epic Dune was released in theaters and on HBO Max. Directed by Canadian filmmaker Denis Villeneuve, the movie was a hit at the box office as well as via streaming, leading to another OTT traffic surge.
For organizations growing larger by the day, network management becomes increasingly complex, and scaling to meet this growth can be a major headache. To battle such complexity without a graphic representation of a network is a tiresome task, which is where network diagram software comes in. Network diagram software allows a network admin to portray the network clearly and legibly through detailed graphics.
Last month, we partnered with AWS to put together a webinar on the importance of implementing a comprehensive redundant networking and multi-CDN monitoring strategy. You can replay the event in full here. In this article, we’ll recap the key takeaways covered by the panel of experts who included Leo Vasiliou, Director of Product Marketing at Catchpoint, and Steve Campbell, our Chief Strategy Officer.
The current version of DX APM continues a long history of innovation for APM technology. More than two decades ago, the solution was the pioneer in byte code instrumentation. DX APM is now a next-generation solution for today’s complex and hybrid enterprise environments. Figure 1: Broadcom’s DX APM has evolved from Wily Technology’s invention of byte code instrumentation-based APM, which was introduced in 1998.
Today, we are launching the newest feature of Broadcom’s Enterprise Software Academy: DX Unified Infrastructure Management (DX UIM) resource pages. DX UIM is redefining infrastructure management with full-stack observability, an open architecture, modern admin and operator consoles, and zero-touch configuration.
DX Unified Infrastructure Management (DX UIM) has more than 150 monitoring probes, which enables IT administrators to monitor everything from traditional mainframe servers to modern hybrid clouds running on a wide range of platforms and operating systems. Traditionally, a separate probe has been required to monitor each specific technology. That’s because the interface that retrieved monitoring metrics was either proprietary or technology specific.
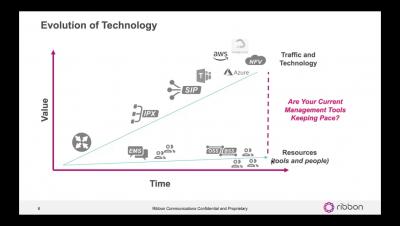
The IT infrastructure landscape has seen tremendous changes over last few years due to evolving technologies, newer business models, and ever-changing market demands. Business, market, and consumer demands are pushing such IT advancements as cloud, mobility, and IoT.
Willy Tarreau, the founder of the HAProxy load balancer, 20 years past its initial, open-source release, still guides the project, often submitting code patches and writing long and meticulous replies on the community forum. Over the years, he has been joined by a cast of regular contributors, but also newcomers. This collaboration has kept the project evolving over time. In this interview, Willy describes his views on the success of the project, and how it grew over the years.
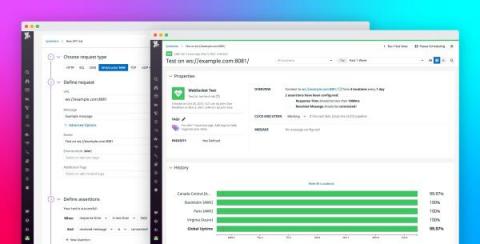
Datadog Synthetic Monitoring allows you to proactively monitor your applications so that you can detect, troubleshoot, and resolve any availability or performance issues before they impact your end users. With our API test suite, you can send simulated HTTP requests to your API endpoints, check the validity of SSL certificates, verify the performance and correctness of DNS resolutions, test TCP connections, and ping endpoints to detect server connectivity issues.
Network AF welcomes Doug Madory to the podcast. Doug is a veteran, a researcher, a writer and Kentik’s director of internet analysis. With his start in the U.S. Air Force within its Information War Center, Doug has now been working in the networking industry for 12 years. After the Air Force, Doug went on to work for Renesys, which was acquired by Dyn, which was later acquired by Oracle.
One of the positive things that came out of events in 2020 was that many of us started working from home. At first, it was kind of weird. But once we realized that what we needed was available online, it became easier. All we had to do was figure out a few new apps, like Slack, Asana and Google Docs. Then, after a couple of weeks of working from home, many of us started having thoughts like, “I wonder if I could wear shorts and my favorite slippers?
The capacity to scale and process high data traffic by monitoring appliances is a critical requirement for organizations aiming to enhance or improve their security and protection from external threats. Excessive incoming traffic demands high-monitoring capabilities as it overwhelms the monitoring tools and places computational bounds that increase exponentially.
In this article, we will explore why it is imperative to constantly monitor network security metrics, what Aruba Clearpass is, and how it helps us manage network security. Then we will look at what Graphite and Grafana are and how to analyze metrics with their help. Finally, we will learn how MetricFire can make it easier for us to work with Graphite and Grafana.
This blog post is part of our data centre networking series: In the previous blogs, we covered the architecture and main drivers behind software-defined networking. In this one, we discuss the impact of softwarisation on the other important data centre building blocks, culminating in software-defined data centres (SDDC).
Network monitoring tools gather and analyze network data to provide network administrators with information related to the status of network appliances, link saturation, the most active devices, the structure of network traffic or the sources of network problems and traffic anomalies.
NGINX is a popular web server featuring a wide range of capabilities, including reverse proxy, mail proxy, HTTP cache, and load balancing. It offers TLS offloading and a health check of the backends and supports gRPC, WebSocket, and HTTP/2. In short, NGINX is a one-stop solution for most of your web server needs. When using NGINX, monitoring its metrics is crucial for tackling issues.
It is crucial for network admins to fully understand their network topology. Even basic troubleshooting can be needlessly complicated without a network topology diagram which is vital for building and maintaining a network. A network topology diagram shows how the various components work together; it shows the devices, connections and pathways of a network visually so you can figure out how devices interact and communicate with one another.
The increasing need for mobility has accelerated many organizations’ shift towards wireless networks, commonly known as Wi-Fi networks. The high bit rate and bandwidth offered by wireless networks enable a better networking experience than their wired counterparts. In an ideal network, once you set up your Wi-Fi components, your end users should be able to connect and access your network with ease.