Operations | Monitoring | ITSM | DevOps | Cloud

The latest News and Information on Monitoring for Websites, Applications, APIs, Infrastructure, and other technologies.

Dashboard Studio: Level-Up Your App with Dashboard Studio

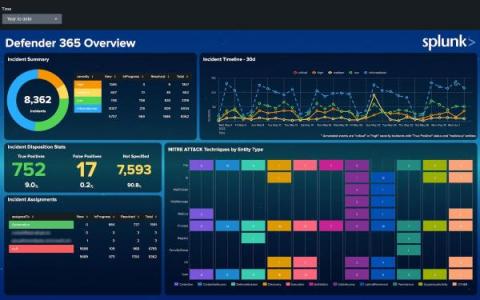
Dashboards are a powerful tool for communicating a lot of information at once. Many Splunk apps are packaged with dashboards to help you make the most of your data. For example, the Microsoft 365 App for Splunk comes with a number of dashboards to provide insights around usage, incidents, and more.

Deconstructing AIOps: Is it even real?

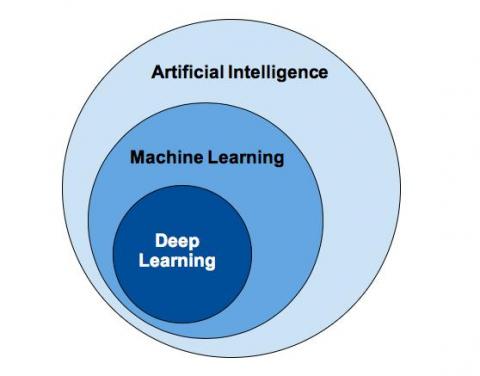
This essay explores AIOps and investigates if machine intelligence applies to IT operations (ITOps). I will dive into objection handling around artificial intelligence (AI) in pop culture and address the limitations around data sets and implicit bias coded into machines. Then, I will delve into what this means for ITOps and the ways AI-based parsing utilities can help operators and developers alike. How does Sumo Logic enable anomaly detection and identify threats?

How to monitor Tomcat with OpenTelemetry

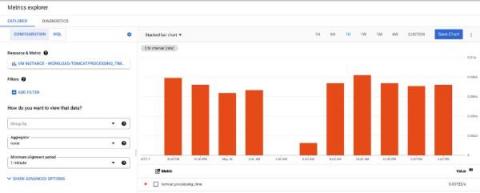
We are constantly working on contributing monitoring support for various sources, the latest in that line is support for Tomcat monitoring using the JMX Receiver in the OpenTelemetry collector. If you are as excited as we are, take a look at the details of this support in OpenTelemetry’s repo. You can utilize this receiver in conjunction with any OTel collector: including the OpenTelemetry Collector and observIQ’s distribution of the collector.

Elastic Observability 8.3: Broader observability for cloud, SaaS, and big data

Note 8.3.0 has an issue that could cause creating and accessing snapshots against Azure snapshot repositories to fail authenticating when using SAS tokens. This impacts self-managed customers who have deployed 8.3.0. Elastic Cloud Azure deployments are not currently being upgraded to 8.3.0 and are not impacted as a result. Visibility is crucial for ensuring application performance but it can be difficult to efficiently scale monitoring across all your critical infrastructures, platforms, and services.

MQTT vs Kafka: An IoT Advocate's Perspective (Part 3 - A Match Made in Heaven)

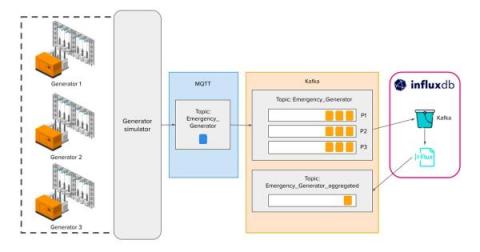
So here we are…the final chapter. In Part 2 of this series, we started to drill down into some of the concepts that make Kafka great. We concluded that although terminology between MQTT and Kafka was similar (for example topics), they behaved quite differently under the hood. We also took a brief overview of Kafka Connect and how we can use some of the enterprise connectors to stream our data to other platforms. Yet we did learn that Kafka does have some shortfalls.

An Introduction to Synthetic Monitoring: Monitor the Uptime of your App and Critical Flows

In a world where the customer’s digital experience is critical to business outcomes, it is crucial to understand how our applications are behaving. As businesses increasingly rely on the performance and availability of revenue-generating applications, the tolerance for downtime and slow response times has plummeted – so the response to production issues must be quick and effective.