Splunk's Purpose
Digital technology drives progress. But along with the power it brings comes the vulnerability to an ever increasing number of threats. That’s why our purpose is to build a safer and more resilient digital world.


The latest News and Information on Monitoring for Websites, Applications, APIs, Infrastructure, and other technologies.
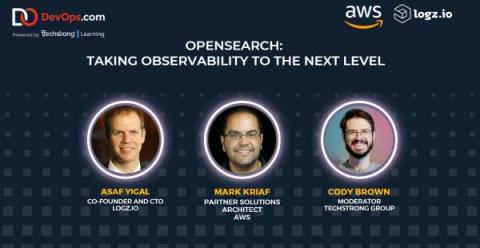
If you’re in the cloud engineering and DevOps space, you’ve probably seen the name OpenSearch a lot over the last couple of years. But, what is your current understanding of OpenSearch, and the components around it? Let’s take a closer look.
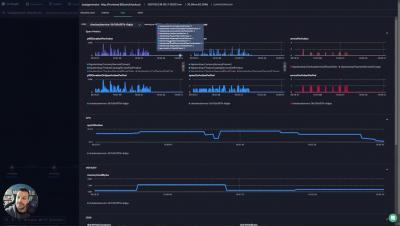
Consider the scenario – You are an SRE (Site Reliability Engineer) joining a team to take charge of their Java applications. It has been reported that a Java application is very flaky in terms of memory issues.
Any software application or a system can have bugs and issues in testing or production environments. Therefore, logging is essential to help troubleshoot issues easily and introduce fixes on time. However, logging is useful only if it provides the required information from the log messages without adversely impacting the system’s performance. Traditionally, implementing logging that satisfies these criteria in Java applications was a tedious process.
Observability has become a critical part of the digital economy and software engineering, enabling teams to monitor and troubleshoot their applications in real-time. Properly managing logs, metrics, traces, and events generated from your applications and infrastructure is critical for observability. A telemetry pipeline can help you gather data from different sources, process it, and turn it into meaningful insights.