Micro Lesson: Field Browser Overview
This video explains how the Field Browser works in the Log Search tab in Sumo Logic.


Logs are vital for every application that runs in a server environment. Logs provide essential information which points to whether the current system is operating properly. Looking through logs, you will gather data on system issues, errors, and trends. However, it is not feasible to manually look up errors on various servers across thousands of log files. The solution? Central errors logging services.
Monitoring systems help DevOps teams detect and solve performance issues faster. With Docker and Kubernetes steadily on the rise, it’s important to get container monitoring and log management right from the start. This is no easy feat. Monitoring Docker containers is very complex. Developing a strategy and building an appropriate monitoring system is not simple at all.
Cloud Monitoring is one of the easiest ways you can gain visibility into the performance, availability, and health of your applications and infrastructure. Today, we’re excited to announce the lifting of three limits within Cloud Monitoring. First, the maximum number of projects that you can view together is now 375 (up from 100). Customers with 375 or fewer projects can view all their metrics at once, by putting all their projects within a single workspace.
Ever been stuck, trying to figure out how to craft a search to answer your question? Splunk is providing guidance right at your fingertips to help you meet your company's objectives, accomplish your end-to-end use cases, and get value out of your Data-to-Everything Platform investment.
One of the great things about Logz.io Log Management is that it’s based on the most popular open source logging technology out there: the ELK Stack (click here to view our thoughts and plans on the recent Elastic license). This means Logz.io users get to leverage log shipping and collector options within the rich ELK ecosystem. So how do you know which log shipping technology to use?
If you’re a RabbitMQ user, chances are that you’ve seen queues growing beyond their normal size. This causes messages to get consumed long after they have been published. If you’re familiar with Kafka monitoring, you’ll call it consumer lag, but in RabbitMQ-land it’s often called queue length or queue depth.
Welcome to part 2 of our blog series, where we go through how to forward container logs from Amazon ECS and Fargate to Splunk. In part 1, "Splunking AWS ECS Part 1: Setting Up AWS And Splunk," we focused on understanding what ECS and Fargate are, along with how to get AWS and Splunk ready for log routing to Splunk’s Data-to-Everything platform.
OpenTelemetry 1.0 (Otel) is finally here (in fact, 1.0.1). The announcement brings the industry closer to a standard for observability. OpenTelemetry v1.0.1 will focus solely on tracing for now, but work continues on integrations for metrics and logs. We are still a long way off from this vision becoming reality. Metrics today are in beta, and this is where the community focus is being applied. Logging is even earlier in its life lifecycle.
The HAProxy Kubernetes Ingress Controller publishes two sets of logs: the ingress controller logs and the HAProxy access logs. After you install the HAProxy Kubernetes Ingress Controller, logging jumps to mind as one of the first features to configure. Logs will tell you whether the controller has started up correctly and which version of the controller you’re running, and they will assist in pinpointing any user experience issues.
Link Analysis is a data analysis approach used to discover relationships and connections between data elements and entities. This is a very visual and interactive technique that can be done in the Splunk platform – and is almost always driven by a person, an analyst or investigator, to understand the data and discover necessary insights specific to the business problem at hand.
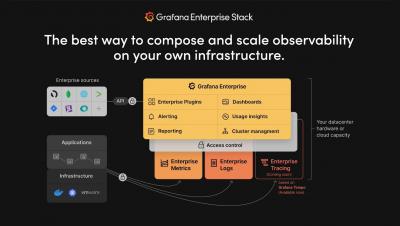
Today, we are launching a new Grafana Labs product, Grafana Enterprise Logs. Powered by the Grafana Loki open source project for cloud native log aggregation, and built by the maintainers of the project, this offering is an exciting addition to our growing self-managed observability stack tailored for enterprises.
PromQL, short for Prometheus Querying Language, is the main way to query metrics within Prometheus. You can display an expression’s return either as a graph or export it using the HTTP API. PromQL uses three data types: scalars, range vectors, and instant vectors. It also uses strings, but only as literals. This intro will provide basic PromQL examples and concepts to understand as you get used to Prometheus queries.
In this post, we’re going to talk about tips for securing the reliability of Loki’s write path (where Loki ingests logs). More succinctly, how can Loki ensure we don’t lose logs? This is a common starting point for those who have tried out the single binary Loki deployment and decided to build a more production-ready deployment. Now, let’s look at the two tools Loki uses to prevent log loss.
Driving productivity of software development and delivery teams is critical for any organization. The six years of research by DevOps Research and Assessment (DORA) showcases the role easy-to-use tooling plays in driving this productivity and in turn a better work/life balance for the team. The research finds that highest performing teams are 1.5x more likely to have tools they consider easy to use.
As our customers scale and utilize Coralogix for more teams and use cases, we decided to make their lives easier and allow them to set up their Coralogix account using declarative, infrastructure-as-code techniques. In addition to setting up Log Parsing Rules and Alerts through the Coralogix user interface and REST API, Coralogix users are now able to use modern, cloud-native infrastructure provisioning platforms.
Maintaining product focus is the best way to guarantee a successful business. As the late great Steve Jobs put it: “if you keep an eye on the profits, you’re going to skimp on the product… but if you focus on making really great products, the profits will follow.” There are a wide variety of statistics available on how much time developers actually spend writing code, anywhere from 25% to 32%.
A decade ago, DevOps teams were slow, lumbering behemoths with little automation and lots of manual review processes. As explained in the 2020 State of DevOps Report, new software releases were rare but required all hands on deck. Now, DevOps teams embrace Agile workflows and automation. They release often, with relatively few changes. High-quality DevOps change management is no longer a nice-to-have, it’s a must. For a lot of DevOps teams, this is easier said than done.
It’s no secret that Amazon Web Services is a powerhouse Cloud provider, and one of the market pioneers in Cloud operations. They do, after all, power some of the world’s biggest and most modern systems we all use and love today. It’s natural then that they attract a lot of users both big and small to deliver high quality and effective solutions. With growing user demand comes the need for new methods of visibility and intelligence.
If your company has multiple servers or services that create log files, reviewing them to find the causes of troubles or to find security breaches, takes up too much time. Log monitoring and event logging software is a powerful tool for solving the problem of reviewing logs and helping you with log analytics, business intelligence, and log management. It allows professionals to track the activities of users, detect changes to applications, hardware, and network connectivity, and more.
Microsoft Monitoring health and usage information is a critical maintenance task for any site or application, whether it’s running in your on-premises datacenter, hybrid or public cloud environment, or hosted environment. Today’s challenge is that enterprises still require end-to-end monitoring insights of their running (and not running) application workloads, while also knowing that they are losing ground on the physical characteristics of managing their own datacenters.
Here at Datadog, we have always strived to build monitoring tools that are robust yet flexible. We are committed to continued innovation, and we believe that when it comes to creating new solutions that complement our customers' existing workflows, our work is never done. That’s why we’re excited to announce that Timber Technologies, the company behind Vector, is joining Datadog.
As promised in part 1, I’m back with a short blog about our five key technology predictions for the UK public sector this year.
We’ve all been watching closely as the Solarwinds hack, known as SUNBURST, gets its due analysis. This attack was sophisticated and rightfully should concern any company. Companies are now — or should be — considering not only what products they are using but to what attack vectors those products are exposed that unduly extend attack surfaces. Solarwinds makes great products — I’ve used them for years.
We are pleased to announce the general availability (GA) of Elastic 7.11. This release brings a broad set of new capabilities to our Elastic Enterprise Search, Observability, and Security solutions, which are built into the Elastic Stack — Elasticsearch and Kibana. This release enables customers to optimize for cost, performance, insight, and flexibility with the general availability of searchable snapshots and the beta of schema on read.
The importance of the security of the Department of Defense’s (DoD’s) networks is no secret (well, of course a lot of it is secret!). This is evidenced by the Department’s IT/cybersecurity budget request that annually tops $40 billion dollars. Last year’s IT and Cyberspace Activities Budget Overview perhaps said it best.
The Internet of Things (IoT) has quickly become a huge part of how people live, communicate and do business. All kinds of everyday things make up this network – fridges, kettles, light switches – you name it. If it’s connected to WiFi, it’s part of the Internet of Things. IoT raises significant challenges that could stand in your way of fully realizing its potential benefits.
Getting visibility into your application is crucial when running your code in production. What do we mean by visibility? Primarily things like application performance via metrics, application health, and availability, its logs should you need to troubleshoot it, or its traces if you need to figure out what makes it slow and how to make it faster. Metrics give you information about the performance of each of the elements of your infrastructure.
Like champagne and party hats, Splunk and Microsoft just go together. Here at Splunk, one of our New Year’s resolutions is to continue to empower our customers with data — in this case, Microsoft data. From cloud, to security, to troubleshooting, we’re back with the latest round of new integrations designed to help you do more with Splunk and Microsoft.
These days, more and more web applications are developed and refined to keep the customer engagement at the highest level possible. It is crucial to provide a smooth experience to the customer hence monitoring is of paramount importance. One key factor in that is monitoring the web server we use. In this article, we will explore Logz.io features by monitoring an Apache Web Server.
Hey there! This is Éamon Ryan from the Solutions Engineering team. Very recently the Splunk data source plugin, which is available with a Grafana Enterprise license, had a new release: v2.1.0. While it added a few good bug fixes for edge cases, the biggest change, I think, was the addition of support for data links! Data links actually show up in a few places inside Grafana.
WaKED-CO (Watch of Knowledge on Emergent Diseases COVID-19) is an initiative launched in record time — deployed just a month after developing a prototype — under the leadership of the health service within the Ministry of Armed Forces in France. The project had one core mission: to make it easier to research the literature around the COVID-19 crisis.
In my previous Link Analysis blogs, "Visual Link Analysis with Splunk: Part 1 - Data Reduction" and "Visual Link Analysis with Splunk: Part 2 - The Visual Part," I used techniques that work well when we have a controlled data set. However, as we know, real data can be messy. When analyzing links in fraud data, the data can be very noisy. Let’s say we want to use IP addresses for link analysis in the Splunk platform. It is not unusual for two people to share an IP address.
This post is a recap of a presentation given at ElasticON 2020. Interested in seeing more talks like this? Check out the conference archive. Network infrastructure is the engine that drives a company’s business. As companies scale, assets that compose this infrastructure become more complex to manage. That means there’s more hardware, more software, and more subscriptions and services that require tracking.
Root cause analysis can be a difficult challenge when you are troubleshooting complex IT systems. In this blog, we are going to take you through how you can perform root cause analysis on your IT Service Intelligence (ITSI) episodes using machine learning, or more specifically causal inference. The approach shown here is included in the Smart ITSI Insights app for Splunk, with this blog largely detailing how to use the ITSI Episode Analysis dashboard.
Enhancing the customer experience and boosting revenue with the power of analytics are key concepts for telecom operators in today’s ultra-competitive business environment. Many telecoms are going through transformation of their system architectures and stacks to change how they operate and manage their day to day operations as well as their strategies and planning for what comes next.
Elasticsearch 7.10 made configuring the lifecycle of your data less complicated. In this blog post I’ll walk through some of the changes, how to use them, and some best practices along the way. Data lifecycle can encompass a lot of stages, so we’ll touch on.
Back in October, we announced the Splunk OpenTelemetry Collector Distribution, which offered the industry’s first production-ready support for OpenTelemetry. This distribution is the recommended way that customers of Splunk’s award-winning observability products capture metrics and traces.
In part one of the "Visual Analysis with Splunk" blog series, "Visual Link Analysis with Splunk: Part 1 - Data Reduction," we covered how to take a large data set and convert it to only linked data in Splunk Enterprise. Now let’s look at how we can start visualizing the data we found that contains links. Why, you may ask, when we just developed a nice table of data that shows us links? Tables of data don’t always work well if you have more than one page of data.
Understanding the Graph API’s architecture and value in standard monitoring scenarios.
Organizations lose billions of dollars to fraud each year. For instance, the financial services sector projects losses to reach $40 billion per year in the next 5-7 years unless financial institutions, merchants, and consumers become more diligent about fraud detection and prevention. Splunk delivers integrated enterprise fraud management software that quickly defines behavior patterns and protects enterprise information from malicious actors.
Elastic moved from an open source license for Elasticsearch and Kibana to a “source available” (aka closed source) license. It was supposed to shut down SaaS companies, but what does it mean for Managed Security Service Providers? Managed Security Service Providers, or MSSPs, are a growing segment in the security business. These firms specialize in deploying security infrastructure, aggregating monitoring and event data, and proactively hunting threats.