Operations | Monitoring | ITSM | DevOps | Cloud

Distributed Tracing In Netdata: OpenTelemetry Traces

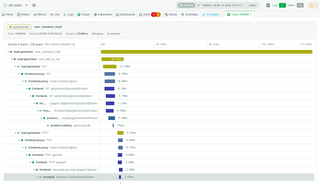
Back in 2020, when we laid out where Netdata was going, the plan listed anomaly detection, log collection and “application traces collection”. The first two shipped years ago. Traces took longer, because we wanted them to work the way the rest of Netdata works: collected and stored on your own nodes, with no separate backend to stand up. Distributed tracing is now available in Netdata.
Who Built This Dashboard, and Are They Still Here?

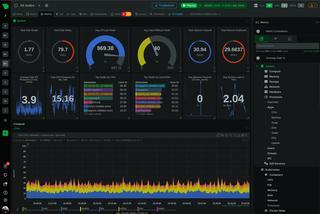
You have lived it, no? When production is down, and you have that chart that says something really strange and peculiar, and nobody knows who did it or when. Production is bleeding. There is a spike on screen. And the chart answers everything except the question you actually have: who built this panel, what did they mean by it, and are they still here?

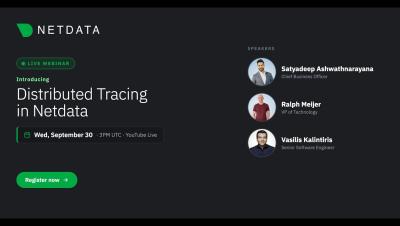
Introducing Distributed Tracing in Netdata

Netdata now supports distributed tracing. In this webinar, we'll demo the new tracing capabilities for the first time: OpenTelemetry trace ingestion, the new tracing dashboard, and the UI built to let you move from a metric anomaly to the exact span that caused it. For years, teams have asked us to close the gap between infrastructure monitoring and application performance. This release does that. Netdata can now ingest traces via OTEL, correlate them with the metrics and logs you already collect, and surface them in a purpose-built interface designed for speed and clarity.

Fleet Monitoring with Netdata: Live Demo

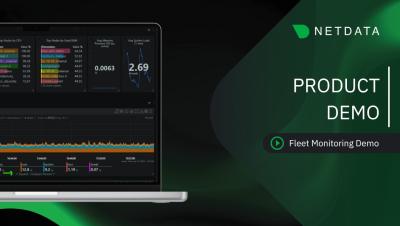
A walkthrough of monitoring a distributed fleet with Netdata, using a simulated fleet of about 1,000 devices spread across regions. We show how the whole fleet reports into a single view: per-second metrics from every node, grouping by region and by customer, a map view that colors each device by health, filtering and saved views for different teams, and an AI-assisted investigation that scans the fleet for anomalies and points to likely causes.