The ELK Stack, which traditionally consisted of three main components — Elasticsearch, Logstash and Kibana, has long departed from this composition and can now also be used in conjunction with a fourth element called “Beats” — a family of log shippers for different use cases. It is this departure that has led to the stack being renamed as the Elastic Stack.
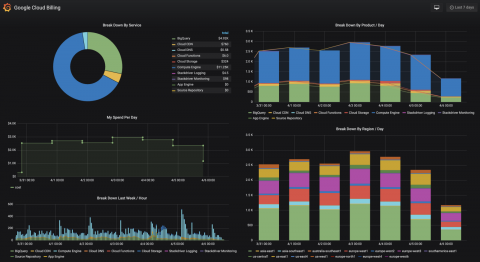
As you may very well know, Kibana currently has almost 20 different visualization types to choose from. This gives you a wide array of options to slice and dice your logs and metrics, and yet there are some cases where you might want to go beyond what is provided in these different visualizations and develop your own kind of visualization.
On February 3, 2019, the Sumo Logic platform experienced its biggest ever spike in incoming data and analytics usage in the company’s history. On this day, close to everybody in the U.S., and many more people across the world, experienced a massive sports event: Super Bowl LIII. The spike was caused by viewers across the world tuning into the football game using online streaming video.
Kibana is the visualization layer of the ELK Stack — the world’s most popular log analysis platform which is comprised of Elasticsearch, Logstash, and Kibana. This tutorial will guide you through some of the basic steps for getting started with Kibana — installing Kibana, defining your first index pattern, and running searches. Examples are provided throughout, as well as tips and best practices.
Logstash is the “L” in the ELK Stack — the world’s most popular log analysis platform and is responsible for aggregating data from different sources, processing it, and sending it down the pipeline, usually to be directly indexed in Elasticsearch. Logstash can pull from almost any data source using input plugins, apply a wide variety of data transformations and enhancements using filter plugins, and ship the data to a large number of destinations using output plugins.