Operations | Monitoring | ITSM | DevOps | Cloud

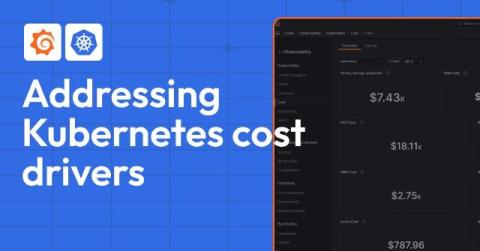
Understand your Kubernetes cost drivers and the best ways to rein in spending

In the previous blog post in this two-part series, we discussed the critical signals you need to monitor in your Kubernetes environment to ensure optimal resource provisioning. These signals include high CPU and memory utilization, frequent pod evictions, slow application performance, and other indicators that your resources are over- or under-provisioned. Monitoring these signals is essential for maintaining an efficient, cost-effective, and environmentally sustainable Kubernetes environment.

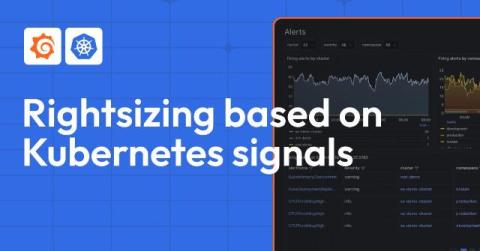
Monitor these Kubernetes signals to help rightsize your fleet

Organizations that run Kubernetes clusters in cloud native environments should do so in a way that’s both operationally efficient and cost effective. However, many organizations don’t prioritize cost optimization until it becomes a pressing need. This may be due to a directive from senior leadership, a significant scale-up or migration of Kubernetes clusters, or an unexpected surge in the cloud bill.

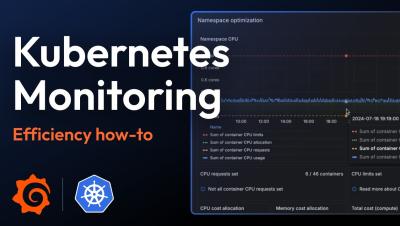
Kubernetes Monitoring Demo: How to Lower Costs and Improve Fleet Efficiency | Grafana

The Kubernetes Monitoring app in Grafana Cloud helps you visualize infrastructure costs across providers, identify unallocated and idle resources, and visualize and optimize Kubernetes resources. In this video, Vijay Tolani shows how to lower costs and improve fleet efficiency with the Kubernetes Monitoring app in Grafana Cloud.

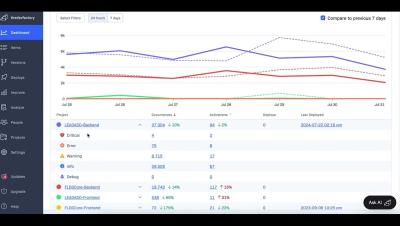
Deep dive into any tile - introducing our Data Explorer

With the release of the Data Explorer, users can now dig into the data behind any tile and slice, dice and explore as needed. This is perfect for those ad-hoc ‘scratchpad’ style scenarios where you want to get some answers without creating yet another dashboard. A couple of weeks ago, we released an awesome new feature that we haven’t had a chance to showcase yet. It’s called The Data Explorer, and I think it’s pretty cool. Let’s dive in!

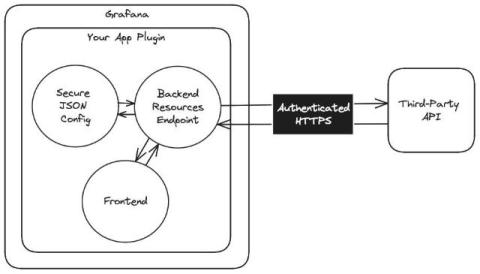
How to authenticate with third-party APIs in your Grafana app plugin

Whether they’re for synthetic monitoring, large-language models, or some other use case, Grafana application plugins are a fantastic way to enhance your overall Grafana experience. Data for these custom experiences can come from a variety of sources, including nested data sources. However, they can also come from third-party APIs, which usually require authentication to access.