
A Comprehensive Guide to Choosing the Right JavaScript Charting Library for Your Project

As a developer, are you stuck between selecting a JavaScript charting library for your progressive JavaScript framework? You have come to the right place; we will guide you on how to choose the right one. As you all know, data visualization is used in different areas and for different purposes. It's used to precisely understand data, speed up decision-making, engage the audience, capture their attention, and improve the user experience overall. When it comes to JavaScript charting libraries, they help you create a variety of charts that can be easily integrated into your application and handle data efficiently. In this article, let's discuss how to choose your charting library based on the JavaScript framework you have selected.
Understanding Your Project Requirements
Selecting the correct JavaScript charting library is solely based on the project and its requirements. Below are some key points to understand what your project requirements are.
Types of Data to Visualize
The main project requirement is what type of data we are planning to show through a graph. This is important because each type of data has its characteristics and requires an effective presentation of it. There are three main types of data: time series, comparative, and geospatial, and they are further discussed below.
Time Series Data
These data mainly display trends over time, such as stock market trends. When displaying these data, it would be ideal if they show real-time updates and have smooth transitions.
Comparative Data
This type of data is mainly based on comparing different categories or values. An example of this is sales performance for different products or exam scores of students. Here, we should be able to visually differentiate between the categories.
Geospatial Data
Analysts mainly use geographical data and maps for analysis. Therefore, the chart depicting this data should be able to display geographical layouts.
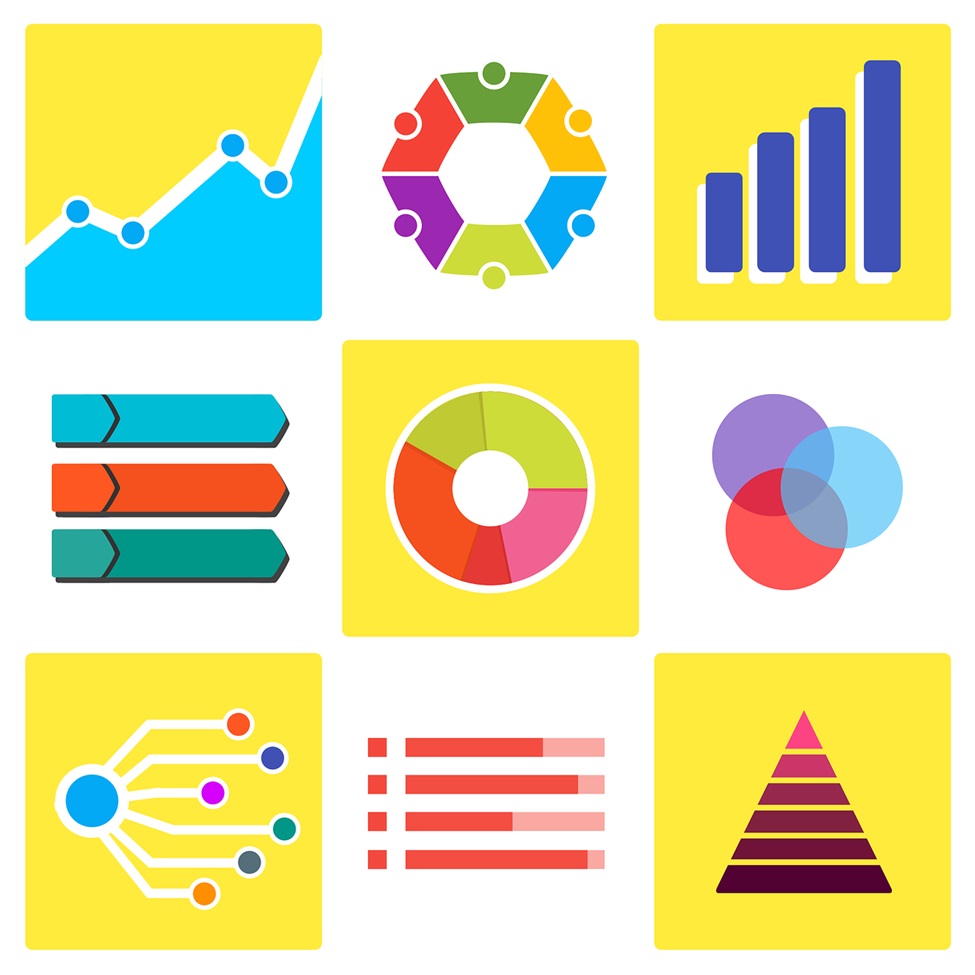
Desired Chart Types
After thinking about what type of data we are going to show, the next project requirement is what type of graph can show the data most effectively to the user.
Line Charts
These types of charts are mainly used to show trends, and the line architecture makes it very easy for a user to read and understand.
Bar Charts
Bar charts are ideal for showing a comparison between different categories of data. Based on the user's preference, these can be displayed either horizontally or vertically.
Pie Charts
Pie charts are ideal for showing proportions or percentages as a whole. Since everything appears in one circle, understanding is very easy.
Scatter Plots
Scatter plots are mainly used to display relationships or correlations between two points. You can use them to identify data patterns, outliers, clusters, and gaps.
Heatmaps
Heatmaps are quite different from the rest. They represent data intensity through color gradients. You can mainly use these to visualize quite complex data matrices.
Interactivity and User Experience
You should consider another requirement, which is the kind of interactivity and user experience you want to give to the end user. You should consider whether you will support features like zooming, panning, tooltips, and drill-downs within the graph.
Performance Considerations
Also, when understanding the requirements, one should consider performance. Since chart rendering speed and responsiveness depend on the dataset you are planning to use, if you have a high volume of data, you should choose the library accordingly.
Popular JavaScript Charting Libraries
Each charting library has its own set of features. Some of the most popular JavaScript libraries are as follows. One such popular library is Sencha Ext JS, which is not just a JavaScript charting library but a fully-fledged JavaScript framework, and this supports virtual DOM. Another is D3.js, which gives you powerful tools for custom visualizations. Highcharts, which is another library, provides a vast collection of chart types with extensive customization options. Finally, there's Google Charts, a web-based charting library that doesn't require local installation.
Compatibility and Integration
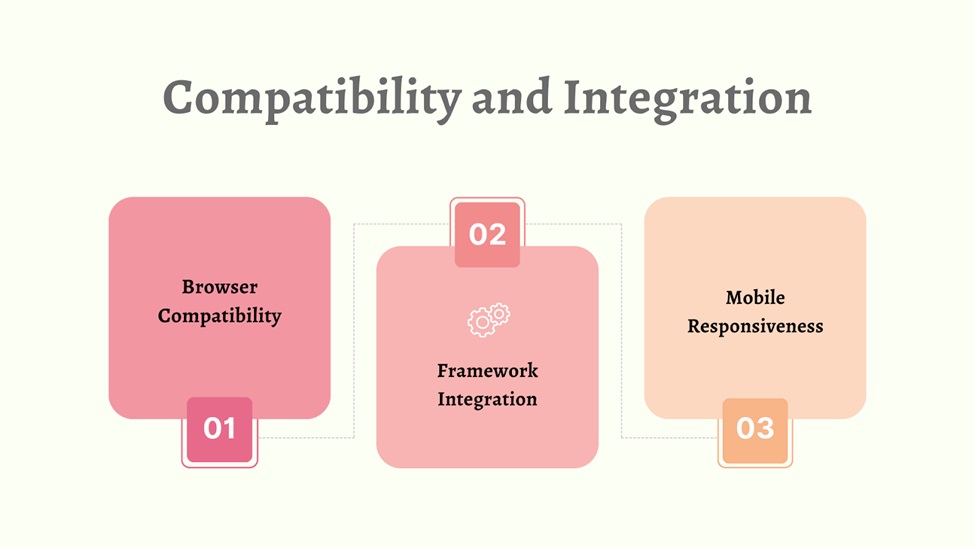
When selecting a JavaScript charting library, it's important to consider compatibility and integration as key factors.
- Browser Compatibility - While most charting libraries typically support all modern browsers like Chrome and Firefox, it's important to check their support for older versions. Ensuring compatibility with older browsers is essential to reach a wider audience.
- Framework Integration - The JavaScript library should integrate seamlessly with popular UI frameworks. Some of the most popular JavaScript frameworks include Sencha ExtJS, an open-source JavaScript framework, Angular, React, and Vue. When choosing a JS library or JS framework, opt for one that is easy to integrate and has robust documentation and community support.
- Mobile Responsiveness - The library should also support responsive design and function well on mobile devices, adapting its charts to various screen sizes. Moreover, selecting a library with touch interactions is advantageous, making it more user-friendly on mobile devices.
Community and Support
When choosing a JavaScript library, it is better to choose one with community support to ensure a smooth web development process.
- Community Size and Activity - The first thing to look for is libraries with active forums, online communities, and social media presence. A larger community indicates that the library is widely used and that help can be easily obtained if any problems occur. For example, the progressive JavaScript framework Sencha ExtJS has a wide community.
- Documentation Quality - This is also mandatory, as clear, comprehensive, and well-maintained documentation is important for learning and integrating the library. The documentation should also contain code examples covering both basic and advanced concepts, API documentation, and FAQs.
- Availability of Support Channels - Apart from the community, some libraries also offer official support channels. Checking for this is an added advantage, as dedicated support can be significantly helpful when developing web applications.
Licensing and Cost
When deciding on a JavaScript framework or library for your project, you should base your choice on several factors, including licensing and cost.
- Open Source vs. Commercial Libraries - Normally, open-source JavaScript libraries are free to use and modify but lack extended features and extended support. In contrast, commercial libraries may be costly but include extended features, documentation, and official support.
- Licensing Models - Normally, open-source licensing models have different restrictions and requirements, and this is the same for commercial licenses. Whatever the case, make sure that the library is compatible with your project's needs.
- Pricing Considerations - The pricing of commercial libraries is based on features, usage volume, and support options. This pricing may also vary from a one-time subscription to a monthly or annual one. Choose the library based on your project's needs and budget.
Navigate the future with confidence in 2024 – a year of limitless tech possibilities with Sencha!
Case Studies
There are many real-world examples of front-end frameworks and charting libraries working together. In this section, let's discuss a few of them.
One example is real-time analytics using Google Charts, where users can view consumer data and sales trends. Another example is a multinational corporation that developed an enterprise resource planning system using Sencha Ext JS. The third example involves the use of Chart.js to create a mobile app showcasing weather patterns and air quality variations across cities.
The key factors to consider from these implementations are as follows. Always match your data types with the library. Make sure you choose a library that delivers responsive and interactive visualizations to keep users engaged with the data. Another lesson is to always look for libraries with good community support and documentation so you can easily overcome challenges when stuck. Lastly, you should never fear to experiment with new libraries.
Decision-Making Process
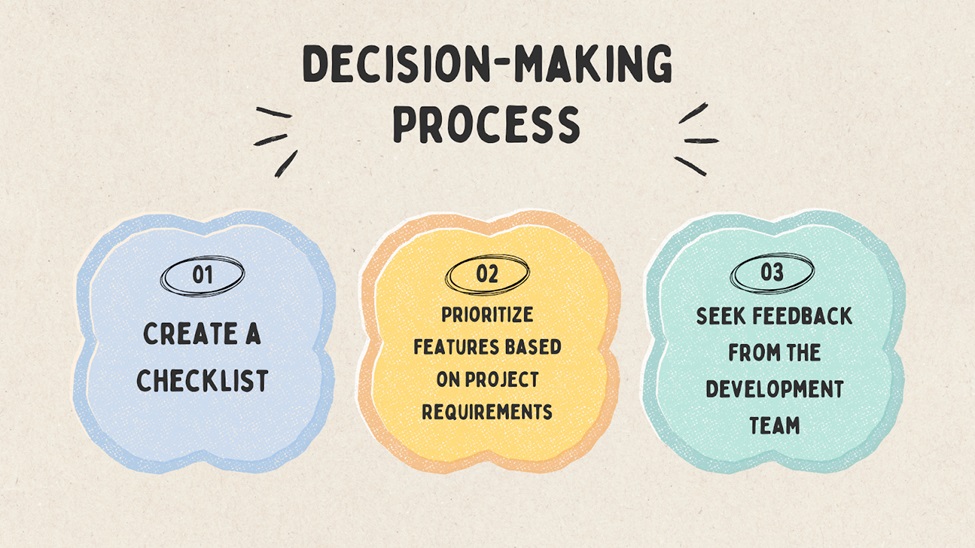
Here is a brief guide to making the most of the decision-making process when selecting the best JavaScript library for your project.
- Create a Checklist - Begin by creating a checklist with all the facts mentioned above. These facts include the type of data, desired chart, interactive user interfaces, performance considerations, compatibility and integration, documentation and community support, and finally, budget. Then, map your project needs to these facts to clarify the ideal project requirements.
- Prioritize Features Based on Project Requirements - After gathering the requirements, the next step is to prioritize the features. For instance, if your project deals with large volumes of data, choose a library that supports that specific feature. Ensure that you differentiate between project needs and wants to prioritize effectively.
- Seek Feedback from the Development Team - Finally, since your development team is responsible for all code execution and enterprise software development, communicate and collaborate with them to ensure the selection of the best library for a smooth single-page applications development process and long-term maintainability.
Conclusion
When choosing the right JavaScript charting library, you should check key factors such as the type of data, desired chart, interactive user interfaces, performance considerations, compatibility and integration, documentation and community support, and finally, budget. All in all, to select the best JavaScript framework/library for charting, you should always experiment and test new libraries. Therefore, make sure to explore and select the best JavaScript charting library to ensure a successful project.
FAQ Section:
Why is efficient data handling crucial in JavaScript frameworks?
This is important since inefficient data handling may have an impact on performance, scalability, resource optimization, and smooth user experience.
How can I implement caching to reduce redundant data requests?
To reduce redundant data requests, you can implement caching at several levels, such as browser caching, in-memory caching, or server-side caching. Furthermore, you can also implement cache invalidation strategies to invalidate the cache once it becomes outdated.
What techniques are available for real-time data handling in JavaScript frameworks?
In the best JavaScript framework, techniques like WebSockets, server-sent events, long polling, and various libraries and different JavaScript frameworks are typically available for real-time data handling.