Operations | Monitoring | ITSM | DevOps | Cloud

Crossed 10 Million Docker Downloads, Improved Dashboards UX with New Panel Types & OSS Summit - SigNal 36

Welcome to SigNal 36, the 36th edition of our monthly product newsletter! We crossed 10 Million Docker downloads for our open source project. We’ve enhanced our Dashboards UX and incorporated feedback from users in different areas of our product. Let’s see what humans of SigNoz were up to in the month of April 2024.

Jaeger vs Tempo - key features, differences, and alternatives

Both Grafana Tempo and Jaeger are tools aimed at distributed tracing for microservice architecture. Jaeger was released as an open-source project by Uber in 2015, while Tempo is a newer product announced in October 2020. Jaeger is a popular open-source tool that graduated as a project from Cloud Native Computing Foundation. Grafana Tempo is a high-volume distributed tracing tool deeply integrated with other open-source tools like Prometheus and Loki.

Integrations for new Data Sources, Upgrades to Alerts & Kubecon Paris - SigNal 35

Welcome to the 35th edition of our monthly product newsletter - SigNal 35! We have made significant advancements in enhancing our product. The integration feature we shipped will enable quick-start monitoring for popular technologies in SigNoz. Let’s see what humans of SigNoz were up to in the month of March 2024.

Grafana vs Splunk - Key Features and Differences

Grafana and Splunk are both used as monitoring tools. But while Grafana is majorly used as a data visualization tool, Splunk is an enterprise security and observability platform. Monitoring tools are essential for any business that wants to have visibility into its IT infrastructure. They provide real-time data that can be used to identify and troubleshoot problems. Grafana and Splunk are two of the most popular monitoring tools on the market. So, which one is better for your business?

Launch Week, Upgrades to Metrics & Query Builder & Access Token Management - SigNal 34

Welcome to the 34th edition of our monthly product newsletter - SigNal 34! Last month was full of action. We did our first launch week, and we were thrilled to see the response. We have shipped some amazing features recently. Let’s see what humans of SigNoz were up to in the month of February 2024.

SigNoz Launch Week - Day 5 - Access Token Mgmt & Onboarding

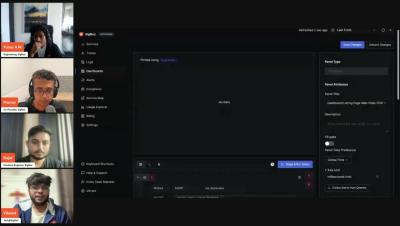
Welcome to last day of SigNoz Launch Week! We will start with a chat with Ankit (CTO, SigNoz) about the evolution of SigNoz, our focus on OpenTelemetry and belief in open-source. Post that we will deep dive into recently released Access Token management feature which will help users programmatically access data stored in SigNoz and unlock powerful use cases. Then we will showcase our new SaaS onboarding flow which makes getting started with SigNoz much easier. We will also discuss the process we follow for improving our documentation & onboarding flow.

SigNoz Launch Week - Day 4 - Logs Pipeline

For day 4, we will showcase the recent work we have done in Logs Pipeline. With Log Pipelines, you can transform logs to suit your querying and aggregation needs before they get stored in the database. Pipelines provide a way to modify the structure and content of log data without needing to change application code or redeploy components. By extracting relevant attributes from logs, pipelines enable more efficient analysis.

SigNoz Launch Week - Day 3 - Frontend Monitoring

Welcome to SigNoz Launch week! In day 3 we will focus on monitoring frontend with SigNoz. We will take examples on how to monitor web vitals of your application and monitoring errors in client applications. This will be followed by a discussion with our maintainers on nuances of building performant frontend application for data dense products like SigNoz. Do tune in!