Operations | Monitoring | ITSM | DevOps | Cloud

Datadog vs Zabbix - Which Monitoring Tool is Right for You?

When it comes to infrastructure and application monitoring, Datadog and Zabbix are two widely recognized tools, each catering to different needs. While Datadog is a cloud-based observability platform offering end-to-end monitoring, Zabbix is an open-source monitoring solution known for its flexibility in tracking network devices and server performance. But which one should you choose?

Top 7 Real User Monitoring (RUM) Tools and Software for Better User Experience

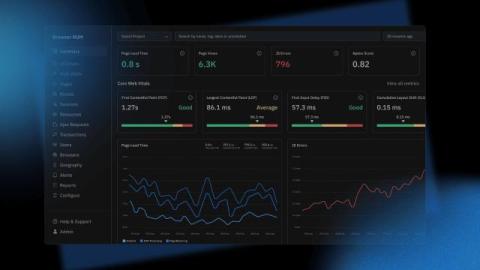
As a software-based company, the most critical thing you can do is maintain control over your users' digital experiences and satisfaction levels. However, without a monitoring plan and technologies that allow you to see how customers interact with your application or website from their perspective is impossible. They provide you with the information you need to determine how well your webapp or website is operating and to avoid slow pages or screens that drive customers to your competitors.

New Browser APIs for Detecting Javascript Performance Issues in the Production

Users nowadays demand the greatest possible experience, which implies top-notch performance. Smooth scrolling, prompt interaction responses, a fast page load time, and flawless animations are all things they anticipate. Local profiling to identify performance issues is convenient, but it only provides a limited amount of information. While things may run smoothly on our high-end developer machines, the user may be dealing with poor hardware and a bad experience.

Dynatrace vs Prometheus - A Detailed Comparison for 2025

When it comes to monitoring solutions, Dynatrace and Prometheus are two powerful tools that cater to different use cases. While Dynatrace is a comprehensive observability platform Prometheus is an open-source monitoring tool designed for scalability and flexibility. But which one should you choose? This detailed Dynatrace vs. Prometheus comparison will help you make an informed decision by evaluating key aspects such as data collection, alerting, integrations, scalability, and pricing.

New Relic vs Zabbix - Which Monitoring Tool to Choose? [2025 Guide]

Monitoring and observability are critical for ensuring system performance, stability, and reliability. New Relic and Zabbix are two widely used monitoring solutions, each catering to different needs. While Zabbix focuses on comprehensive infrastructure monitoring, New Relic excels in application performance monitoring (APM) and full-stack observability.

ELK vs New Relic: Which Monitoring Tool Should You Choose in 2025?

Effective observability is crucial for maintaining system performance and reliability. ELK Stack and New Relic are two widely used solutions that offer distinct approaches to monitoring, tracing, and logging. This comparison will help you understand their core features, use cases, and strengths, enabling you to make a more informed decision on which tool best aligns with your organizational goals. Lets get started!

New Relic vs Kibana: A Guide to Choosing the Right Tool in 2025

New Relic and Kibana are popular monitoring and observability tools that provide a wide range of features for analysing and visualizing data. In this post, I have compared New Relic and Kibana based on key aspects such as data ingestion, dashboards and visualizations, log management, alerting, pricing and more. Lets take a look at each tool's capabilities, strengths, and weaknesses to help you understand how they differ and which one is best suited to your needs.

Top 15 PostgreSQL Monitoring Tools in 2025

Imagine your PostgreSQL database slowing down unexpectedly, causing delayed queries, application timeouts, and frustrated users. In a data-driven world, database performance issues can lead to downtime, lost revenue, and poor user experience. PostgreSQL monitoring tools help detect and resolve performance bottlenecks, ensuring optimal database health, efficient query execution, and high availability.

Understanding PromQL Facets: Unlocking Advanced Metrics Analysis

PromQL (Prometheus Query Language) is a powerful and flexible query language used to retrieve and manipulate time-series data stored in Prometheus. One of its lesser explored but immensely valuable features is its ability to handle facets, a concept that can simplify complex metrics analysis and enhance observability. In this blog, we will dive deep into PromQL facets, exploring what they are, why they matter, and how you can use them to gain better insights into your systems.