Operations | Monitoring | ITSM | DevOps | Cloud

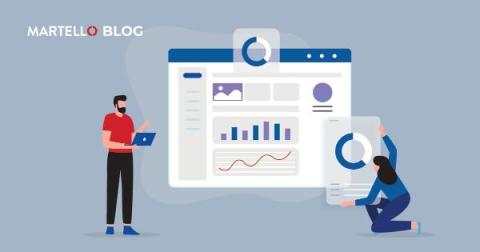
Teams Call Quality Dashboard: The First Step In Teams Insight

Do you have much experience using the Call Quality Dashboard (CQD)? Does your team go on about it being a ‘good starting point’? Do you even know what the CQD does? Fear not. If you answered ‘no’ to any of those questions, we’re going to fill you in with all the details that matter and give you some additional direction on how to get the most out of them. The bottom line is they’re a good starting point, but a long way from being a proactive performance solution.
The concise guide to Loki: How to work with out-of-order and older logs

For this week’s installment of “The concise guide to Loki,” I’d like to focus on an interesting topic in Grafana Loki’s history: ingesting out-of-order logs. Those who’ve been with the project a while may remember a time when Loki would reject any logs that were older than a log line it had already received. It was certainly a nice simplification to Loki’s internals, but it was also a big inconvenience for a lot of real world use cases.

With OpenTelemetry, ComplyAdvantage overhauled its observability (twice)

ComplyAdvantage, which provides compliance and risk management tools, has overhauled its observability platform twice in two years, first moving from on-prem Grafana OSS to Datadog, and then migrating from Datadog to Grafana Cloud. Join Principal SRE Adam Wilson to hear how his team’s approach to observability evolved, and how their increased OTel usage made it possible to migrate twice — and to get the most out of Grafana Cloud for metrics, logs, traces, Kubernetes monitoring, and more.

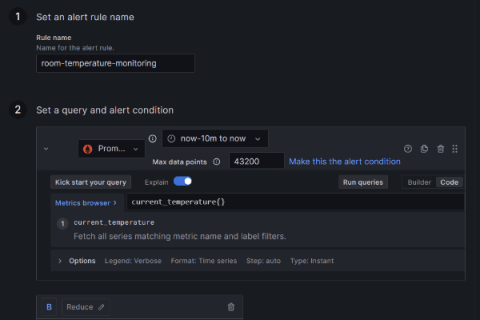
How to create alerts to monitor sensor data with Grafana, Prometheus, and Telegram

When monitoring sensor data, such as data from a weather station, a home security system, or a home automation assistant, it’s useful to have an alerting system in place, as well. By setting up alerts for sensor data, you can automatically receive notifications when any significant event occurs — whether that’s someone arriving at your front door or a thunderstorm rolling in.

Improved Dashboard Performance, Better Trace View UX & New Logs Processors - SigNal 32

Welcome to the last SigNal of 2023! 12 months of building and shipping things to make open-source observability available to teams of all sizes. What a great journey it has been for Team SigNoz in the year 2023. We crossed some great milestones - raised $6.5MN to supercharge our growth, more than 15,000 Github stars, and 8.6 million Docker downloads. And the best part of our journey has been building with our community.

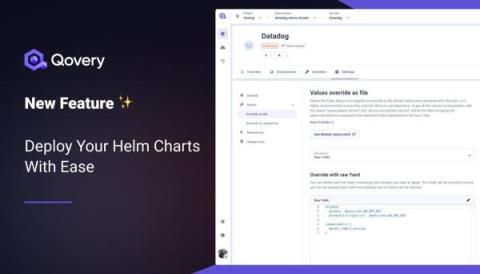
New Feature: Deploy Your Helm Charts With Ease

Today, I'm thrilled to announce a game-changing feature that's set to revolutionize how Platform Engineers and Developers interact with Kubernetes: the introduction of first-class support for Helm Charts within Qovery 🥳. This latest update, now generally available, empowers our users to deploy any Helm Chart with unparalleled ease, marking a significant leap forward in our mission to streamline application deployment for everyone.

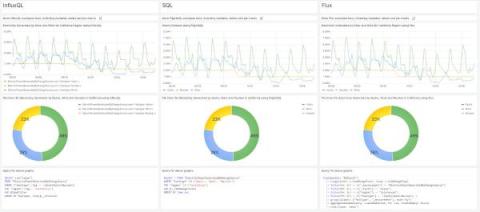
A comparison of InfluxQL, SQL, and Flux query languages for Grafana dashboards

Grant Pinkos manages two businesses near Detroit, Michigan. He enjoys Industrial IoT, Industry 4.0, guitar solos, and Pomeranians, and holds a BS in engineering and an MBA. Grant is a Grafana Champion and is very active in community discussions. He has also presented at GrafanaCON and authored a tutorial.

The concise guide to Loki: How to get the most out of your query performance

Thanks for joining me for Part 3 of “The concise guide to Grafana Loki,” a series of blog posts that takes a closer look at best practices for various aspects of using the log aggregation system. Today’s post is my holiday present for all the folks out there running Loki who would like to get the most query performance they can out of their cluster.

How to integrate Grafana Alerting and Telegram

Grafana Alerting helps you identify issues almost immediately after they occur — and you don’t have to constantly check your system to get the insights you need. Instead, Grafana Alerting sends alert notifications to reach you wherever you are, whether that’s in a Slack channel or in a messaging app like Telegram. Telegram is a viable option for receiving alerts, especially when you want personal or individual notifications rather than those sent to a team.