SRE vs. SWE: Similarities and Differences
SREs and SWEs complement each other, but they perform different tasks and focus on different priorities.


SREs and SWEs complement each other, but they perform different tasks and focus on different priorities.
Maybe it’s the time of year or the change in temperature, but sometimes using xMatters Flow Designer can seem a little… spooky? Maybe it’s the unlimited capability it offers, or maybe it’s that it can make changes for you without you being aware they’re taking place. But every once in a while, we’re not sure if we’ve just set up workflows too effectively, or that something a touch paranormal is happening with xMatters.
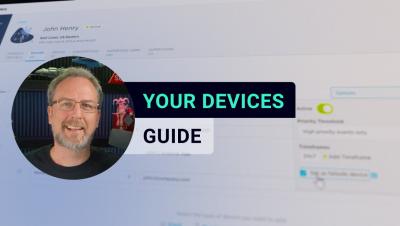
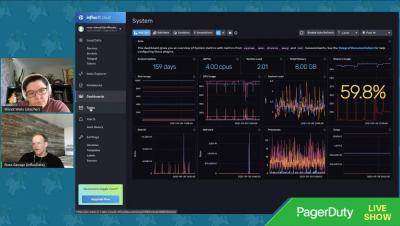
Life happens—even when you’re on-call. You can’t take your laptop everywhere, but whether you’re on the train, at dinner, or at the gym, you can count on the Datadog mobile app for access to key data about the status and performance of your applications. Now, you can use Datadog mobile widgets to build an on-call mobile dashboard directly on your phone’s home screen, so it’s even easier to track the data you care about from anywhere.
When you’re deep into an incident and there’s alerts firing, decisions to be made, and people to escalate to, it’s easy for outward communication with your customers to fall off the priority list. In many regards this makes sense; it seems natural to put all of your focus and energy into minimising the impact and getting things back on track as soon as possible.
In the last two years, we have seen the rise of remote and hybrid work, and with that, a proliferation of tools and apps needed to support critical communication and collaboration. Finding that app-life balance has become increasingly complex, so simplifying “how” we work is key for every organization.
The Centers for Medicare & Medicaid Services (CMS) scrutinizes hospital readmission rates across the U.S. each year, and it levies financial penalties on organizations that overshoot acceptable hospital readmission rates. As healthcare systems across the country embark on a journey to introduce patient-centric models to their organizations, they must align their resources with ever-changing regulations for them to thrive.
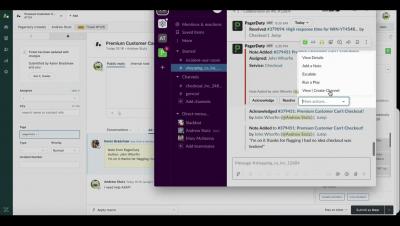
Ever heard the saying “Too many cooks”? If you’ve responded to incidents, you’ll likely understand the parallels. There are cases when incident command on a public channel isn’t the best option: Whatever your reason, we’ve got you covered. Now available, users can spin up a private slack channel for an incident. Read more how to do this here.
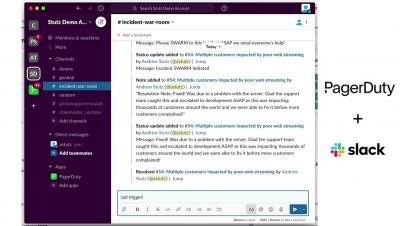
ChatOps has become an integral part of software development and IT operations, as teams rely on automated notifications to take the place of manual alerts. In the past, if there was an alert, someone would need to manually find that notification. Then, they would have contact team members to notify them one by one so they could start working on a resolution. In this complex network of communications, it was easy to lose information, duplicate work, and simply waste time coordinating the team.
Learn about the key roles within an incident response team, as well as optional incident roles you may not have thought about.
Many ITOM or ITSM tools come with built-in features for alerting and notifications and are able to send at least an email or text notification upon incidents to operations teams. But is this enough reliability to respond to and handle major and critical incidents? Recently, we have been surprised to see more and more monitoring tools listed as alerting tools on review platforms like G2.
Last week, we spent some time talking to Gergely Orosz about our thoughts on what happens when an incident is over, and you're looking back on how things went. If you haven't read it already, grab a coffee, get comfortable, and read Gergely's full post Postmortem Best Practices here. But before you do that, here's some bonus material on some of our points.
People are more than happy to talk about their successes, but if you ask them about their failures, they can be much more hesitant to share. Failure is a subject that, interestingly enough, is entangled with the emotion of shame. Yet it’s integral to achieving anything novel, and the learnings that come from failure are unparalleled. So, let’s find ways to get more comfortable with failing, and figure out why people fear it.
A Service Level Agreement (SLA) is a document that details the expected level of service guaranteed by a vendor or product. This document generally sets out metrics such as uptime expectations and any payoffs if these levels are not met. For example, if a provider advertises an uptime of 99.9% and exceeds 43 minutes and 50 seconds of service downtime, technically the SLA has been breached and the customer may be entitled to some type of remuneration depending on the agreement.
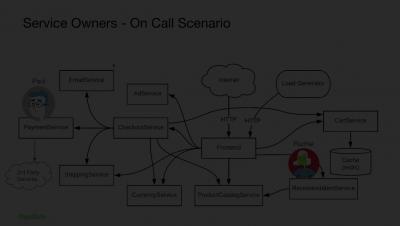
It’s 2 AM and you’re paged when you’re still awake – how well can you find what you need to fix the latest mistake? When the incident begins it might only be impacting a single service, but as time progresses, your brain boots, the coffee is poured, the docs are read, and all the while as the incident is escalating to other services and teams that you might not see the alerts for if they’re not in your scope of ownership.
Companies that underwent accelerated digital transformations during the past 18 months are looking to understand how they can improve their operational maturity to handle the increase in complexity. This is paramount to an organizations’ future success.
Technology companies are at the forefront of innovation, changing the way consumers and the general public interact with their everyday lives. As the late Stan Lee so wisely stated, “with great power comes great responsibility,” and this heightened pressure often leaves little room for error when an issue arises—which happens more often than you’d think.
This is the final blog in our series focusing on CloudOps maturity, where we’ve been looking at the key findings from a recent IDC study, commissioned by PagerDuty. In our previous blogs, we discussed the people-based transformations and the technological changes that organizations must undergo to mature their CloudOps practices.
The link between DevOps and artificial intelligence for operations (AIOps) has only started to become clear within the last few years. Monitoring and alerting has evolved from a "black box approach," where you don't actually know what's happening, into observability, where you have access to data that provides everything you possibly need to know about your IT systems. How does AIOps come into play? AIOps is the practice of applying artificial intelligence, machine learning, and advanced analytics to automate and improve IT operations. Since it entered as a formal discipline with Gartner in 2016, IT teams have been trying to figure out how to employ it to make their lives easier.
The patient-centered care (PCC) model enhances the way providers interact with patients during the care delivery process. Clinicians that show compassion and empathy toward patients are more likely to achieve meaningful, positive doctor-patient relationships. Indeed, care teams that prioritize PCC have a proven approach to improving patient satisfaction and increasing patient retention.
There’s an incident. Your teams need to communicate with the development team that owns the service, but that team is too busy to stop and chat. Meanwhile, you in central IT have business leaders asking for updates, angry internal users calling the help desk, and customer service representatives asking for information. You have hundreds of tickets all pertaining to the incident in your ticketing system.
Facebook’s October 2021 outage was the type of event that gives SREs nightmares: A series of critical business apps crashed in minutes and remained unavailable for hours, disrupting more than 3.5 billion users around the world and costing about 60 million dollars. As incidents go, this was a pretty big one.
xMatters is part technology, part service reliability, and a little bit of magic. If you’ve spent time on the xMatters website, you’ll likely have seen a number of valuable use cases for the platform—it can alert SREs when there’s a website outage, it can accelerate product development for DevOps teams, it can manage on-call schedules and alerts for support teams.
Digital transformation accelerated for many companies during the last 18 months. While it may have been on the agenda prior to COVID-19, teams were pushed to extreme speeds to digitize and meet the rising online demand. During this time, organizations learned important lessons that they’ll carry on with them into this new future. Leaders can take these learnings and use them to build better products, healthier and more efficient teams, and a happier customer base.
In a world with everything digital, you need AIOps to help ensure uptime and break through the noise. Still not sold? Let's explore 5 ways SRE and DevOps teams are using AIOps to boost existing monitoring tools.
There’s a number of monitoring and observability solutions on the market today. It almost reminds me of the automobile market and the endless number of automobiles available. Sure, they all get you from point A to point B, in some way. But some automobiles do it faster, smoother, more efficiently, with guidance, more comfort, storage space, perhaps towing capability, and even autonomously. Moogsoft is the automobile you’ve been dreaming about in the monitoring and observability market.
Today, we are happy to announce the launch of Service Catalog to help you better manage, query, and learn about the services that exist in your infrastructure. At FireHydrant, we envision a world where all software is reliable, and we’re on a mission to help every company that builds or operates software get closer to 100% reliability. Service Catalog helps you get closer to 100% reliability.
Yesterday the most used social media platforms in the world were inaccessible for 6 hours straight. Later, in a press release, Facebook revealed that the outage was due to configuration changes in their routers. There is no doubt that Facebook has an intense incident response plan, yet a small blind spot resulted in a significant business interruption. So how do we avoid this? The truth is, outages and performance issues are bound to happen in any network.
Less than 24 hours ago, the world came to a “social standstill” as Facebook, and its sister companies, WhatsApp and Instagram, became unavailable, leaving its 3.5 billion users in a flap. The outage, which lasted almost 6 hours, shut off access for users and businesses all over the world and caused ripple effects that we will likely continue to see in the immediate (and perhaps not-so-immediate) future.
This July, we launched The State of Digital Operations, which sheds light on the volume of real-time work, its growth over time, and how that increasingly burdens technical teams.
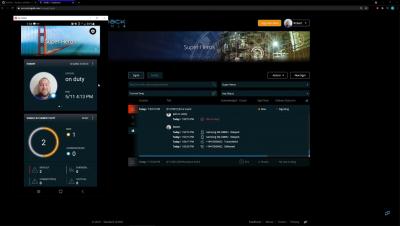
Splunk On-Call (Formerly VictorOps) is a popular incident response and on-call management platform that allows engineering and operations teams to collaborate with ease and resolve issues faster. As part of the Splunk Observability Suite, Splunk On-Call is combined with related products to achieve the goal of bringing monitoring, troubleshooting, and investigation, into a single, comprehensive view — simplifying the process from incident detection to resolution.
The four key takeaways for SREs from Google’s State of DevOps 2021 report
Productivity is defined by measuring the amount of output over a given time frame. However, this discounts the quality of output, which is crucial in moving toward a more complete definition of productivity. Relating to services, increases in productivity generally highlight the amount of feature releases over time. This leaves out the critical measurement of quality compared to quantity. This is where a Service Catalog can greatly enhance true productivity within an engineering organization.