Operations | Monitoring | ITSM | DevOps | Cloud

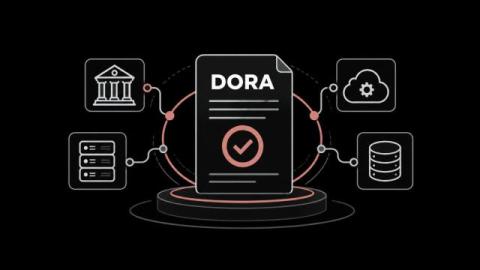
What Is DORA Compliance? The Digital Operational Resilience Act Explained

The Digital Operational Resilience Act has applied to EU financial firms since 17 January 2025. The first year was mostly paperwork. In year two, supervisors want proof, and most of that proof sits with IT operations. DORA joins the other rules on your cybersecurity compliance list, with much tighter clocks. A major incident needs its first report within 4 hours of classification. In this blog, you will: By the end, you will know what DORA compliance asks of your IT team and where to begin.

IT Offboarding and How to Revoke Access Without Leaving Security Gaps

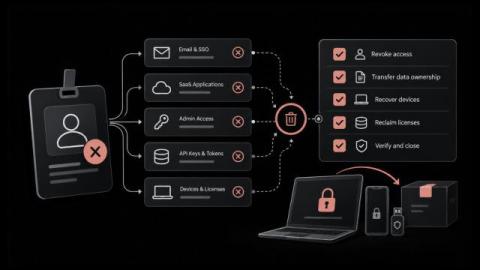
When someone leaves your organization, how sure are you that every account they could reach was closed? Most IT offboarding starts by disabling the employee's main login account, and that step usually works. The risk comes from the other accounts, tools and devices the person used that the main account does not control. These include personal API tokens, shared vendor portal logins, laptops still with a courier and SaaS tools bought on a department card.

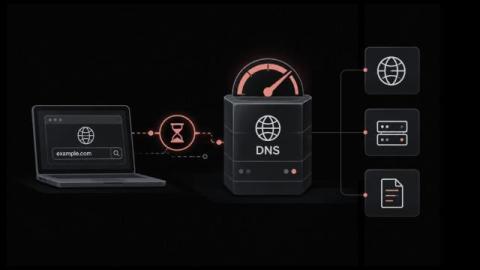
How to Fix Slow DNS Lookups Across Clients, Resolvers and Networks

Why does every page, login and business application hesitate before anything loads, even when bandwidth graphs look healthy? That pause usually comes from name resolution: no connection starts until its hostname has been translated into an IP address, and whatever time that translation takes is added to the request. Slow DNS seldom shows up as a clear error.

Latest Log Management Strategies in 2026: From Raw Logs to Business Value

Discover the latest log management strategies for 2026 and learn how AI and automation turn raw logs into actionable insights. See how modern log management can reduce investigation time, improve incident response, control costs, and strengthen visibility across hybrid and multi-cloud environments.

ITSM to Deep Observability with ServiceOps & ObserveOps | Motadata Webinar

In this webinar recording, discover how ServiceOps and ObserveOps connect IT service management with deep observability. Learn how IT teams can identify root causes faster with unified visibility across incidents, metrics, logs, traces, applications, and infrastructure. Don't forget to like, share, and subscribe for more insights on ITSM, observability, AIOps, and IT operations.

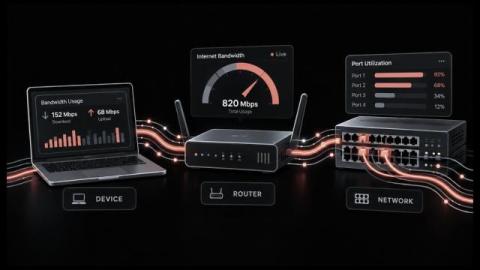
How to Check Bandwidth Usage Across Your Network

Most bandwidth problems get investigated after the complaints arrive, and by then the traffic that caused them has moved on. The numbers you need sit in several places at once. A laptop knows its own traffic. The router knows what leaves for the internet, and only the switches see how much network bandwidth moves inside the building. Checking bandwidth usage at the right layer saves hours of guessing. Most of the methods ship with hardware you already own.

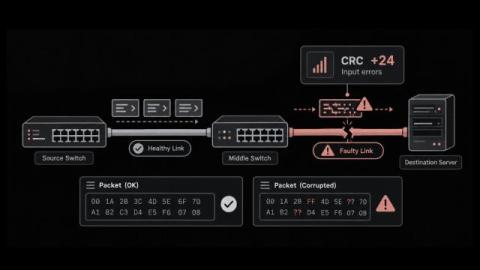
What is a CRC Error and How to Find the Faulty Link Before It Slows the Business

Why does a switch port look healthy on every dashboard while people on that floor keep reporting dropped calls and slow file transfers? Often the cause is CRC errors, a port counter that most dashboards do not show by default. Each CRC error means a unit of data arrived damaged and the switch discarded it. Put simply, a CRC error tells you the receiving device noticed the data changed somewhere in transit.

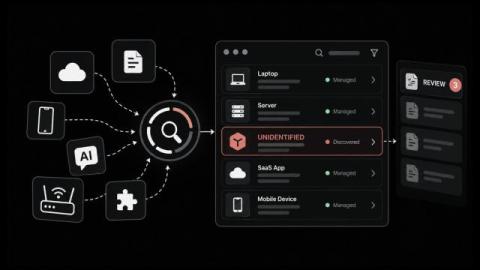
What Is Shadow IT? Meaning, Risks, and How It Shows Up in Your Asset Inventory

Most shadow IT starts with a marketing team that needed a file-sharing tool on Tuesday. The next procurement cycle was six weeks away. That gap keeps widening. According to Gartner, 75 percent of employees will acquire, modify or create technology outside IT's visibility by 2027, up from 41 percent in 2022. Shadow IT is the name for that tech. IT asset discovery is where it first shows up. In this blog, you will: By the end, you can turn shadow IT into a weekly review queue.

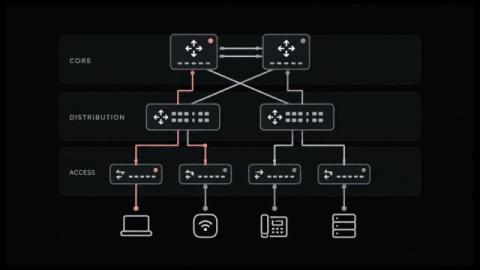
What Is a Network Topology Diagram? Types, Examples and How to Build One That Stays Current

Most network diagrams are accurate exactly once: the day they are finished. The network keeps changing, the drawing does not, and the gap shows up during the next outage. According to the Uptime Institute Annual Outage Analysis 2026, failure to follow established procedures remains the leading driver of human-error outages. A wrong diagram is how a right procedure hits the wrong port. The fix is a network topology diagram that matches the live network topology.