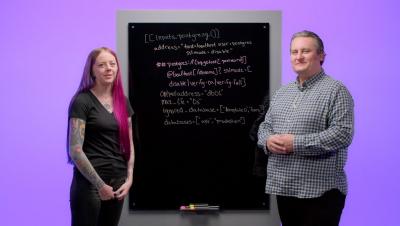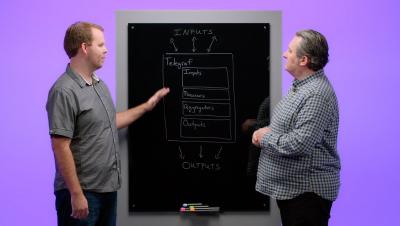
How To Configure a Telegraf Plugin
Telegraf plugins use TOML for configuration. Here, developer Mya Longmire explains how Telegraf reads TOML for plugins and provides some tips to help you get up and running quickly with Telegraf.


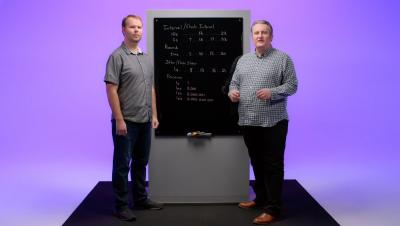
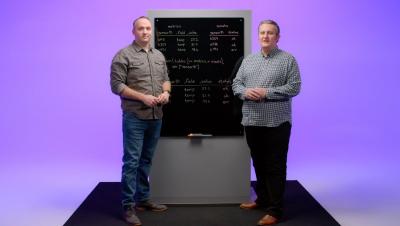
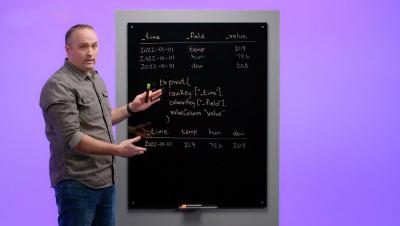
Time series data differs from “normal” data in an interesting way. The essential characteristic is that the data’s primary point of reference is a timestamp showing at which point in time a sample of data was measured. Time series databases like InfluxDB are helpful for situations that involve this kind of data.