Operations | Monitoring | ITSM | DevOps | Cloud

February 2023

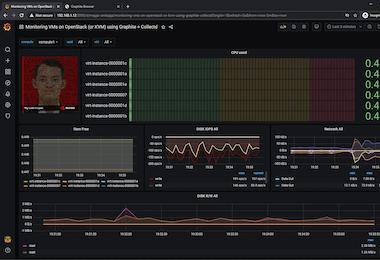
The Best Graphite Dashboard Examples

Graphite provides time-series metrics in an open-source database. With Graphite dashboards, you can see key performance indicators (KPIs) as well as other metrics visually. Dashboards typically display data as graphs, charts, and tables and can be customized to meet the specific needs of an organization. Using dashboards, organizations can monitor and analyze various aspects of their performance, such as system utilization, application performance, and resource utilization, using web interfaces.

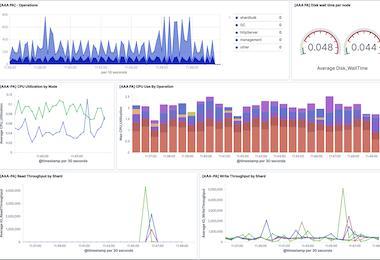
The Best OpenSearch Dashboard Examples

OpenSearch dashboards are a powerful tool for visualising and exploring data stored in an OpenSearch-compatible data store such as Elasticsearch. With OpenSearch's intuitive interface and advanced analytical tools, this visualisation tool makes it easy to gain insights into your data and monitor and alert upon key metrics. Throughout this article, we'll look at some of the most impressive OpenSearch dashboard examples that showcase it’s capabilities and versatility.