Operations | Monitoring | ITSM | DevOps | Cloud

July 2022

How to monitor Apache Flink with OpenTelemetry

Apache Flink monitoring support is now available in the open source OpenTelemetry collector. You can check out the OpenTelemetry repo here! You can utilize this receiver in conjunction with any OTel collector: including the OpenTelemetry Collector and observIQ’s distribution of the collector. Below are quick instructions for setting up observIQ’s OpenTelemetry distribution, and shipping Apache Flink telemetry to a popular backend: Google Cloud Ops.

BindPlane OP Build Process - Using Goreleaser

BindPlane OP is written in Go. It is a single http webserver, serving REST, Websocket, and Graphql clients. It includes embedded react applications for serving the user interface. Go provides us with the ability to produce a single binary program that has no external dependencies. The binary is not dynamically linked to external libraries, meaning it is easy to build, deploy, and run on any platform supported by the Go compiler. BindPlane OP officially supports Linux, Windows, and macOS.

How to monitor Jetty using OpenTelemetry

You can now monitor Jetty for free using top of the line open source monitoring tools in OpenTelemetry. If you are as excited as we are, take a look at the details of this support in OpenTelemetry’s repo. The best part is that this receiver works with any OpenTelemetry collector: including the OpenTelemetry Collector and observIQ’s distribution of the collector. Jetty uses the JMX receiver.

Serverless Monitoring In The Cloud With The observIQ Distro for OpenTelemetry

In this part 1 of a blog series on serverless monitoring, we will learn how to run the observIQ Distro For OpenTelemetry Collector, referred to as “oiq-otel-collector”, in Google Cloud Run. There are many reasons that someone may want to run monitoring in a serverless state. In our example, we will be monitoring MongoDB Atlas, a cloud hosted version of MongoDB.

How to monitor Hadoop with OpenTelemetry

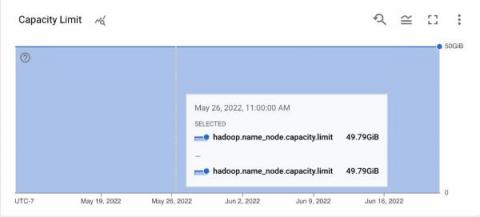
We are back with a simplified configuration for another critical open-source component, Hadoop. Monitoring Hadoop applications helps to ensure that the data sets are distributed as expected across the cluster. Although Hadoop is considered to be very resilient to network mishaps, monitoring Hadoop clusters is inevitable. Hadoop is monitored using the JMX receiver. The configuration detailed in this post uses observIQ’s distribution of the OpenTelemetry collector.

How to Collect and Ship Windows Events Logs with OpenTelemetry

If you use Windows, you want to monitor Windows Events. With our latest contribution to the observIQ OpenTelemetry Collector, you can easily monitor Windows Events with OpenTelemetry. You can utilize this receiver in conjunction with any OTel collector: including the OpenTelemetry Collector and observIQ’s distribution of the collector. Below are steps to get up and running quickly with observIQ’s distribution, and shipping Windows Event logs to a popular backend: Google Cloud Ops.

How to monitor Zookeeper with OpenTelemetry

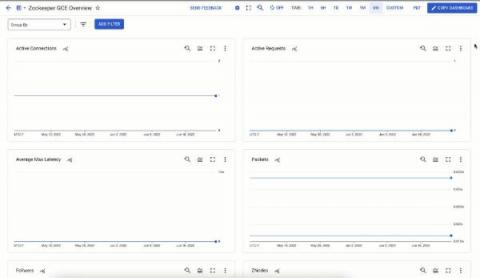
We are back with a simplified configuration for another critical open-source component, Zookeeper. Monitoring Zookeeper applications helps to ensure that the data sets are distributed as expected across the cluster. Although Zookeeper is considered to be very resilient to network mishaps, monitoring is inevitable. To do so, we’ll set up monitoring using the Zookeeper receiver from OpenTelemetry.

How to Monitor Varnish with Google Cloud Platform

We’re excited to announce that we’ve recently added Varnish monitoring support for Google Cloud Platform. You can check it out here! Below are steps to get up and running quickly with observIQ’s Google Cloud Platform integrations, and monitor metrics and logs from Varnish in your Google Cloud Platform.

How to monitor Cassandra using OpenTelemetry

We are constantly working on contributing monitoring support for various sources, the latest in that line is support for Cassandra monitoring using the OpenTelemetry collector. If you are as excited as we are, take a look at the details of this support in OpenTelemetry’s repo. The best part is that this receiver works with any OpenTelemetry collector: including the OpenTelemetry Collector and observIQ’s distribution of the collector.

How to monitor JVM with OpenTelemetry

We are constantly working on contributing monitoring support for various sources, the latest in that line is support for JVM monitoring using the OpenTelemetry collector. If you are as excited as we are, take a look at the details of this support in OpenTelemetry’s repo. The best part is that this receiver works with any OpenTelemetry collector: including the OpenTelemetry Collector and observIQ’s distribution of the collector.