Operations | Monitoring | ITSM | DevOps | Cloud

September 2022

Practical Guide on Setting up Prometheus and Grafana for Monitoring Your Microservices

Observability is a very important aspect of software that’s often taken for granted. You need to have visibility into what your application is doing at different levels to better understand an issue when it occurs. There are multiple open-source tools and initiatives to help you achieve improved visibility. When we talk about observability, there are three parts to consider: logs, traces and metrics.

Making Peace with the Grim Reaper - Liveness & Readiness Probes | Guy Menahem & Anais Ulrichs

Learn all about liveness and readiness probes (done right) from Guy Menachem - Solution Architect at Komodor, the first Kubernetes-native troubleshooting platform, with vast experience working with DBs from old-timey mainframes to cloud-native systems.

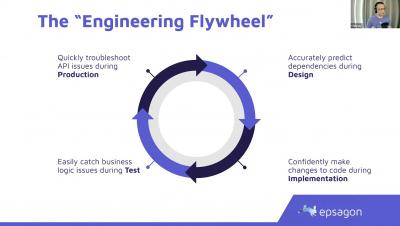
Observability and Resilience in Microservices-based Environments [Komodor + Epsagon Webinar]

Kubernetes has made it easier to manage and scale microservices. However, keeping track of so many moving parts is often challenging for Dev & Ops teams. Achieving clear observability for better monitoring and troubleshooting is key to improving the development process.