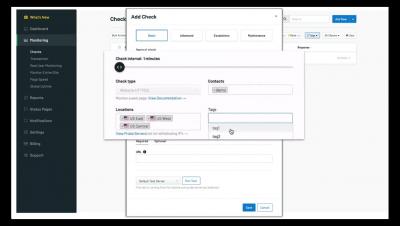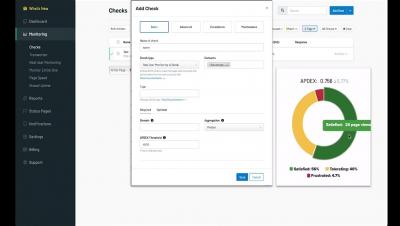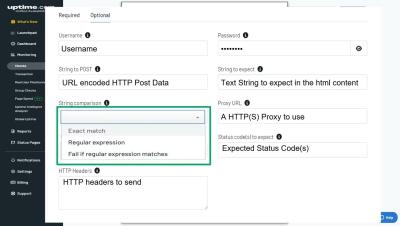
Uptime.com HTTPS Check Setup
Review basic checks settings and optional fields for the Uptime.com HTTP(S) check.


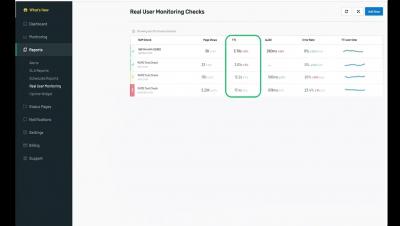
What if I told you one of the most common mistakes businesses make is reporting on website performance without understanding user experience? What if I said there was much more to website performance monitoring than simply alerting you when your site is experiencing a downtime outage? No two websites – or baselines – are exactly the same.
Have you ever had to purchase a CPU or a GPU? If so, you have probably come across the term “bottlenecking”. There is a certain threshold where output exceeds ability to process, and that can prevent optimal system functionality. One of the methods used in computing to overcome these bottlenecks is multi-threading, where requests are processed simultaneously by multiple threads. We can apply a similar principle to downtime monitoring.
Two major shifts are simultaneously taking place in the world of website monitoring: the acceleration of digital dependence has increased the need for high-performing websites and the frequency (and severity) of downtime outages continues to climb. These shifts have made it more important than ever for businesses of all sizes and industries to monitor uptime and page speed.