Log data enrichment - make your logs smarter
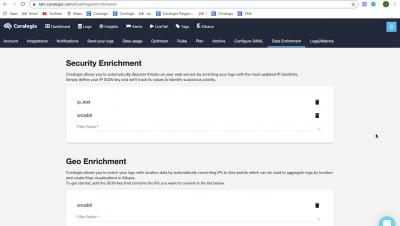
Coralogix enriches your log data in real time so that you can build maps, protect your environment, and add elements that will turn your data smarter.


You’ve created the perfect design for your indices and they are happily churning along. However, in the future, you may need to reconsider your initial design and update the Elasticsearch index settings. This might be to improve performance, change sharding settings, adjust for growth and manage ELK costs. Whatever the reason, Elasticsearch is flexible and allows you to change index settings. Let’s learn how to do that!
Many of the available configuration management tools, such as Ansible, Terraform, Puppet, Chef, and Saltstack provide automation for infrastructure, cloud, compliance and security management, and integration for deployment and continuous deployment (CI / CD). But what is the best tool to start automating your particular environment? The difficult task of evaluating Configuration Management Tools prevents DevOps from evolving technically and proposing improvements to the environment they manage.
In this survey of over 200 CIOs in the US, the IDC analyses the critical role played by Log Analytics in any modern infrastructure.
Logging is critical for monitoring and troubleshooting your Node.js project. The open-source Winston logger helps take a load off our shoulders by making it easier to centralize, format, enrich, and distribute the logs to fit a particular need. Winston creates custom logger instances which can be configured to act as centralized logging entities. Essentially, the internal architecture of the module decouples the actual event logging from the implementation of the storage logic.
In this article, we’ll learn about the Elasticsearch flattened datatype which was introduced in order to better handle documents that contain a large or unknown number of fields. The lesson examples were formed within the context of a centralized logging solution, but the same principles generally apply. By default, Elasticsearch maps fields contained in documents automatically as they’re ingested.
One of the most common dashboards for metric visualization and alerting is, of course, Grafana. In addition to logs, we use metrics to ensure the stability and operational observability of our product. This document will describe some basic Grafana operations you can perform with the Coralogix-Grafana integration. We will use a generic Coralogix Grafana dashboard that has statistics and information based on logs. It was built to be portable across accounts.
For many companies today business success depends on quality efficient build, test and delivery processes. Development and deployment environments become complex very quickly, even for small and medium companies. A contributing factor to this complexity is companies’ adoption of microservices. This is where modern CI/CD solutions like CircleCI come in to help streamline these processes.
In this post we will cover some of the main use cases FluentD supports and provide example FluentD configurations for the different cases.