Operations | Monitoring | ITSM | DevOps | Cloud

May 2022

On-premise vs. On the Cloud

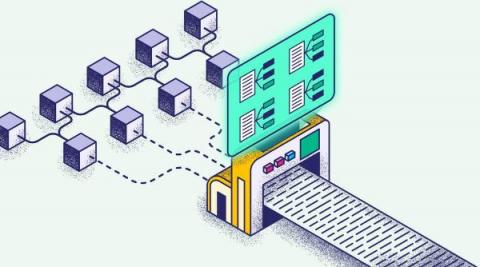
Since its emergence in the mid-2000s, the cloud computing market has evolved significantly. The benefits of reliability, scalability, and reduced set-up costs have created a demand to fuel an ever-growing range of “as-a-service” offerings, resulting in an option to suit most requirements. But despite the advantages, the question of cloud or on-premise remains valid.

AWS Service Observability using OpenTelemetry

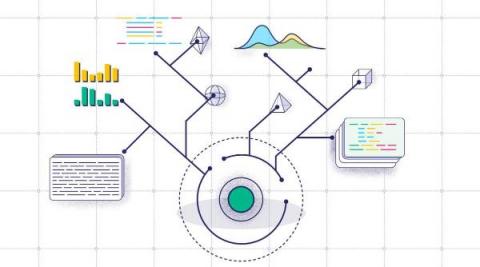
Efficient use of observability statistics is essential to any microservice architecture. OpenTelemetry is a project supported by the Cloud Native Computing Foundation (CNCF) to enhance the observability of microservice projects. AWS Distro for OpenTelemetry (ADOT) is an AWS-supported distribution of the OpenTelemetry project specifically designed to improve the observability of AWS projects.

Benefits of Logging Agents

You probably have heard of logging agents, such as Logstash or Fluent Bit, if you’ve been investigating log analysis, monitoring, and observability. If so, and you’re wondering what logging agents are and why you might need them, you’ve come to the right place. This article will look at what logging agents are for, their advantages, and what you can use instead of a logging agent.

4 Different Ways to Ingest Data in AWS OpenSearch

AWS OpenSearch is a project based on Elastic’s Elasticsearch and Kibana projects. Amazon created OpenSearch from the last open-source version of ElasticSearch (7.10) and is part of the AWS system. The key differences between the two are topics for another discussion, but the most significant point to note before running either distribution is the difference in licenses. ElasticSearch now runs under a dual-license model, and OpenSearch remains open-source.

Kubernetes Logging with Elasticsearch, Fluentd and Kibana

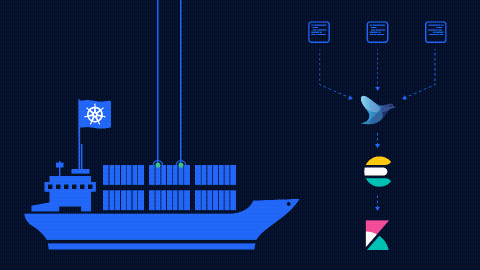
Kubernetes, a Greek word meaning pilot, has found its way into the center stage of modern software engineering. Its in-built observability, monitoring, metrics, and self-healing make it an outstanding toolset out of the box, but its core offering has a glaring problem. The Kubernetes logging challenge is its ephemeral resources disappearing into the ether, and without some 2005-style SSHing into the correct server to find the rolled over log files, you’ll never see the log data again.

Proactive Monitoring vs. Reactive Monitoring

Monitoring is a fundamental pillar of modern software development. With the advent of modern software architectures like microservices, the demand for high-performance monitoring and alerting shifted from useful to mandatory. Combine this with an average outage cost of $5,600 per minute, and you’ve got a compelling case for investing in your monitoring capability.