Empowering Platform teams with Portals
Making development teams productive, faster, using platform services and self-service portals like Backstage.


For a very long time, businesses in various industries have been using smart sensors. However, with the development of the Internet of Things (IoT), their significance has increased. Sensors represent the beginning of a data collection chain that, when processed by IoT platforms, generates essential insights for assertive decision-making and even for developing new business ideas. Generally, a smart sensor has three main components: This technology is already used in many countries.
In the world of databases, cardinality refers to the number of unique sets of data stored in a database. If we drill down a little further, we can think of cardinality as the total number of unique values possible within a table column or database equivalent. When thinking about time series data, we can ask some specific questions about cardinality. What does cardinality look like in practice? When does cardinality become a problem? How do we prevent cardinality issues?
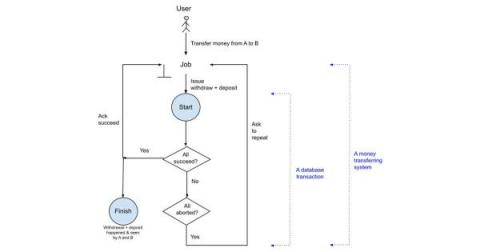
Deduplication is an effective alternative to transactions for eventually consistent use cases of a distributed database. Here’s why. Building a distributed database is complicated and needs to consider many factors. Previously, I discussed two important techniques, sharding and partitioning, for gaining greater throughput and performance from databases.
Fun fact: Observability goes all the way back to the 1960s, coined by scientist Rudolf Kálmán as a way to measure a system through its output. Now, over six decades later, observability has fragmented into several specialized segments — from application observability, to security observability, and everything in between. The two segments driving the most confusion are data observability and observability data.
From time to time throughout my career, I have been involved in projects with dramatic releases when we built and delivered something very new and very special. The release of InfluxDB Cloud, powered by IOx (referred to as “InfluxDB IOx” for short below) absolutely meets those criteria. I want to explain my personal views of why this release is so impactful and why I am so excited to be part of it.
Time-varying entities may contain multiple time-varying and static attributes, making mapping them a particular challenge. Time is notorious in modeling tasks. Indeed, the temporal aspect exacerbates the complexity of the modeling task, making simple diagrams look pretty complex. The temporal dimension becomes particularly nasty when it takes part in identifying entities. The figure on the right visualizes the typical database example.