Operations | Monitoring | ITSM | DevOps | Cloud

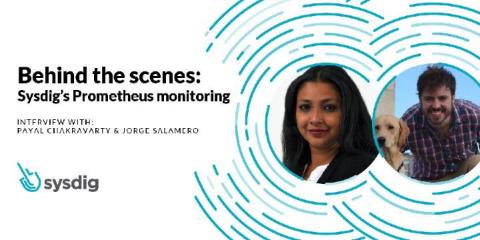
Sysdig's Prometheus monitoring behind the scenes

A few weeks ago, we announced that Sysdig is offering fully compatible Prometheus monitoring at scale for our customers, as well as a new website called PromCat.io hosting a curated repository of Prometheus exporters, dashboards and alerts. This got me thinking about how we were actually able to implement the changes necessary to offer this in our platform.
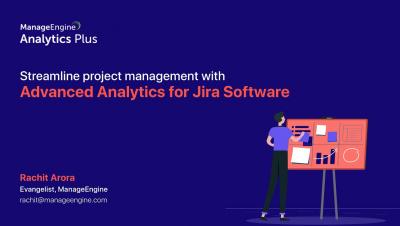
Introducing Custom Reports & Dashboards for Jira Software

Launching ManageEngine Analytics Plus for Jira Software and Jira Core. Discover important Agile & Scrum metrics, KPIs, reports and dashboards that project managers now have access to, allowing them a level of visibility into their team and projects like never before.

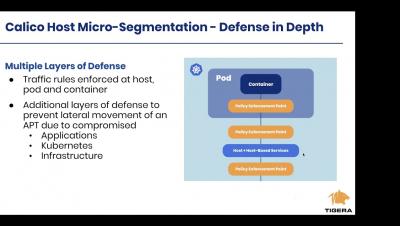
Getting up and running with Calico Host Micro segmentation Protection on AWS

In this online training, we will explain how to install and configure Calico on a vm/host to apply network policy to resources outside your K8s cluster. The talk will be primarily a walkthrough and demo and you will receive all manifests and instructions to do the demo on your own after the session.

Ruby Garbage Collection: More Exciting than it Sounds

Running software uses computer memory for data structures and executable operations. How this memory is accessed and managed depends on the operating system and the programming language. Many modern programming languages manage memory for you, and Ruby is no different. Ruby manages memory usage using a garbage collector (also called gc). In this post, we’ll examine what you, a Ruby developer, need to know about Ruby’s gc. Use the links below to skip ahead in the tutorial.