Operations | Monitoring | ITSM | DevOps | Cloud

The Place Where Modern Operations & Technology Come Together


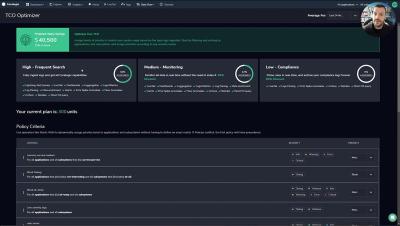
TCO Overview
Coralogix TCO Optimizer allows you to assign different logging pipelines for each application and subsystem pair and log severity. In this way, it allows you to define the data pipeline for your logs based on the importance of that data to your business.

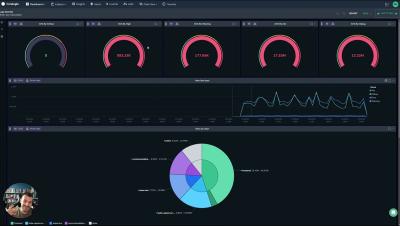
Coralogix Deep Dive - Custom Dashboards
Let's explore the rich and powerful world of Custom Dashboards in Coralogix, with explanations of every widget, powerful functionality, flexible variables and much more. This video will leave no stone unturned!
Infinite Visibility in the Coralogix Custom Dashboard Solution
Explore the Archive Query mode in Coralogix Custom Dashboards, to visualize data that has long since left your archive, without paying for enormous indexing costs. Hold the data in your cloud account, and query, transform and enhance, with a single button press.

Easy Alert and Metric Creation in Coralogix Custom Dashboards
Defining Alerts and Metrics in Coralogix is the easiest thing in the world. In this video, we'll explore three different alerts and metrics that can be generated, without writing a line of code.

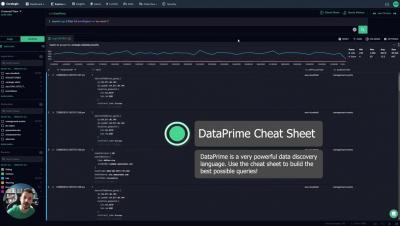
Powerful Queries with DataPrime and Coralogix
DataPrime is much more than a simply querying language. It's a data discovery language, allowing for powerful aggregations and insight generation, right in the Coralogix UI.

How to Query Coralogix Log Archive Efficiently
The Coralogix Remote Archive solution is incredibly powerful, but there are techniques to maximise the value you get out of the Coralogix platform.
Coralogix Deep Dive - Remote Query for Logs
In this video, we'll explore the functionality and best practices with Coralogix Remote Query for Logs. Coralogix supports direct, unindexed queries to the archive for both logs and traces, and stores data in cloud object storage directly in the customers cloud account, making for rock bottom retention costs, blazing fast performance and outstanding scalability.

High Performance Archive Queries in Coralogix
Coralogix Remote Query for Logs is incredibly powerful, enabling direct queries of archive data without the need to index. To get the most out of this feature, here are some simple tricks and techniques that you can use to make your queries even faster.
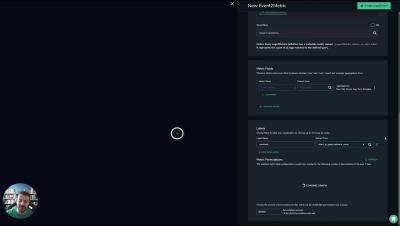
Coralogix Deep Dive - Events2Metrics
Alerts2Metrics is a crucial component for any cost optimization effort on the Coralogix platform. In this video, we'll explore Events2Metrics for both logs and spans, we'll discuss best practices and how to get the most out of this excellent feature.