
A guide to single-page application performance

Single-page applications (SPAs) present a unique approach to building web applications. They help to increase development velocity and can present big performance wins when it comes to delivering a fast and seamless user experience.
Monitoring SPAs for performance still comes with a unique set of challenges, like choosing the most impactful metrics, gaining visibility into app performance over time, and knowing what metrics you can get from the browser.
The main benefit of using SPAs is that a page does not need to reload when the content on the page changes. However, this feature, and the fact the page does not reload, is what makes it hard to monitor SPA performance.
In this post, we’ll provide you with the six best areas of your application to monitor as a developer wanting to improve the performance of your SPAs:
- Track your virtual pages
- XHR calls and virtual page performance
- Track custom performance timings
- Deployments and performance
- Response codes
- JavaScript errors
1. Track your virtual pages
Multi-page applications (MPAs) have distinct URLs that are used to identify the unique pieces of content a user can see. For example, many websites have a new URL for their contact information, for each product they have, each blog post, and more.
When building tracking for these different “virtual pages,” it’s important to understand what piece of content your users are seeing and how long they spend on the page. You can let Raygun know that the user is now viewing a different page by calling the”pageView” event as shown below:
rg4js('trackEvent', {
  type: 'pageView',
  path: `/${window.location.pathname}`
});
Additional documentation about the track event method can be found in our documentation.
2. Monitor XHR call distribution and virtual page performance
SPAs rely heavily on API calls to load data for pages, so it’s helpful to have visibility into the performance of both XHR calls and virtual pages. We’ll look at both in detail below.
Monitoring the distribution of your XHR calls is an easy way to track trends for high-value XHR calls, for example, those made to add a product to a cart.
From your main Performance page in RUM, you will find XHR calls in the “Most requested XHRs” module at the bottom of this page.
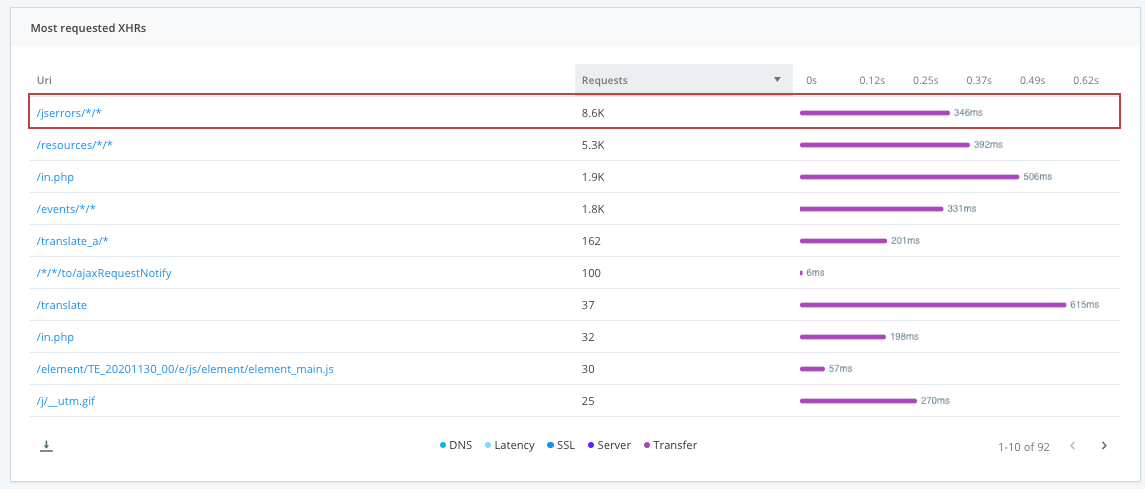
Most requested XHRs module in RUM
After clicking into the XHR that you’d like to investigate, you will be presented with the XHR call distribution in a histogram alongside the XHR’s performance over time.
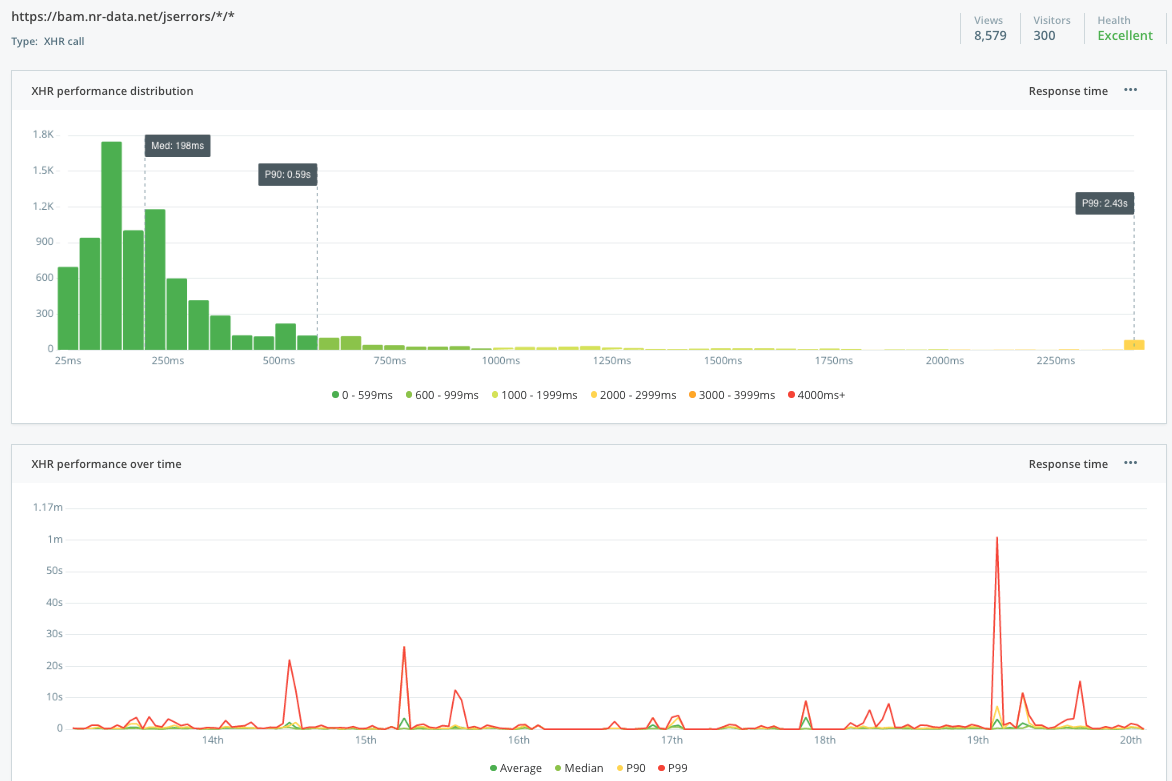
The XHR’s performance distribution over time
The histogram above displays a count of the number of XHR calls with a load-time between two specific time periods. This distribution shows the range of load-times for the same XHR to help better understand the impact.
The XHR performance over time chart helps to monitor how our performance is trending. Combined with the deployments chart, we can start to identify where a bad deployment has contributed to a performance increase or decrease.
3. Track custom performance timings
SPAs typically have fewer full page loads than a multi-page application — an advantage for user experience — but it does come at the cost of the number of performance metrics we can measure.
There’s no standard way of knowing when a virtual page has finished loading because it’s dependent on each use case. However, you can instrument your own custom performance metrics and send them to Raygun at points in your application when you know for certain your virtual page has loaded.
Custom timings can be used by calling the following method. In the example below, we are sending a custom timing to Raygun labeled “timeToInteractive”.
rg4js('trackEvent', {
  type: 'customTiming',
  name: 'timeToInteractive',
  duration: 1200,
});
Custom timings can be sent at any point in the application’s lifecycle, allowing you to track events after the initial load easily. For example, you might track the time for a video to start playing once it scrolls into view, or the response time of a subsequent XHR call made after the load.
The XHR’s performance distribution over time
4. Correlate recent deployments with performance
Because we’re always adding new code to our software, it’s essential to know how your app reacts to those releases. Otherwise, you can quickly find your website performing 20% slower than last year due to no-one keeping tabs on how deployments affect user experience.
By focusing on the trend in key performance metrics over time, you can ensure that the development efforts with your SPA are leading to better customer experiences.
To view deployments alongside performance, head to the Performance over time graph on your main dashboard. From there, you’ll see your deployments stacked underneath.
![]()
The XHR’s performance distribution over time
5. Monitor application response codes
XHR calls are made to transfer data from the server to the browser. If you have a failing or poor performing XHR call, that could mean parts of your application are not behaving as intended, leading to a poor user experience with your application.
Monitoring the response codes of XHR calls is an important factor in maintaining a finger on the pulse of your application health. If you see an uptick in bad response codes, you’ll know you need to investigate because this means your users are being presented with error states and poor experiences.
To see your XHR response codes navigate to the “response codes” section in RUM.
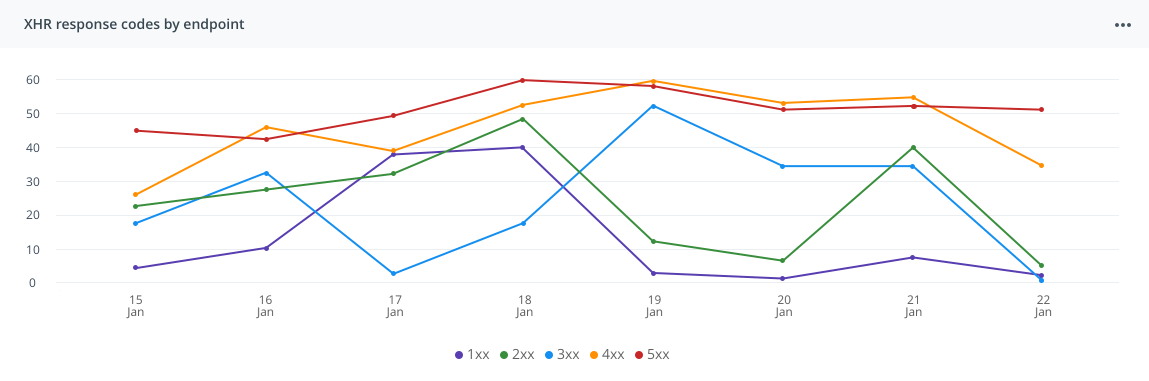
Easily spot trends with the grouped view in Raygun of your application’s response codes.
Drill down into the response code to diagnose where an uptick in a specific response code has come from, so you can resolve it faster for any customers who may be impacted.
6. JavaScript error tracking
While not strictly related to monitoring your SPA’s performance, making sure you have JavaScript error tracking in place is important when considering your customers’ digital experiences.
Application errors can mean that your users do not see the content they want or need. And the one thing worse than a slow loading page is one that doesn’t load at all.
Final thoughts on how to improve the performance of your SPAs
The tips above should give you what you need to know to improve the performance of your SPAs.
SPAs can be more performant, but on the other side of the coin is how difficult they are to monitor. At the end of the day, it’s the customer’s experience that matters the most, so make sure you are giving them the best your app has to offer.
If you would like to learn some more tips on prioritising front-end performance, we have a deep dive into resolving performance bottlenecks in this article and webinar.