Operations | Monitoring | ITSM | DevOps | Cloud

Putting FinOps theory into practice with SquaredUp

The public cloud has revolutionized IT by making infrastructure on-demand, scalable, and self-service. However, this convenience comes at a price. In the cloud, engineers can instantly spin up resources and spend company money with the click of a button or a line of code, bypassing traditional procurement and finance approval processes.

Observability for Azure Virtual Desktop with SquaredUp

Managing Azure Virtual Desktop doesn’t have to mean jumping between portal blades, logs, and metrics trying to piece together what’s happening. In this webinar, you’ll learn how to design and implement a single, operational observability dashboard for Azure Virtual Desktop (AVD) using SquaredUp Cloud — transforming fragmented telemetry into clear, actionable insight. Whether you're responsible for performance, user experience, or operational stability, this session will give you a structured, repeatable framework for monitoring your AVD estate with confidence.

SquaredUp vs Grafana: The Enterprise IT dashboard showdown

Modern enterprises operate across an increasingly complex mix of hybrid cloud services, and productivity platforms. As environments scale, stakeholders need a single pane of glass (SPoG) to understand what’s happening across IT operations without jumping across dozens of disconnected tools.

The 5 best Jira reporting tools for 2026

Jira is the backbone of project management for thousands of agile teams worldwide. But while Jira excels at tracking issues and sprints, its native reporting can leave teams wanting more — especially when it comes to sharing insights, visualizing trends, and integrating data from across the business. That’s where dedicated Jira reporting tools come in. In this guide, we rank the 5 best Jira reporting tools on the market today.

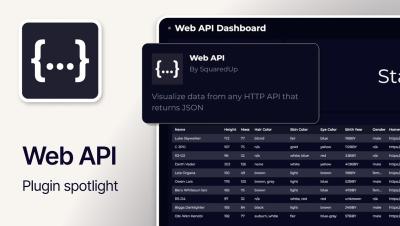
Building Web API integrations that scale (5 key lessons)

I've used the Web API plugin with a wide range of APIs, and each one taught me something new. But before diving into building, I learned to pause and ask: What am I actually trying to display? Not what data the API can give me, but what would be useful on a dashboard? That shift in thinking — from ‘fetch everything’ to ‘fetch what matters’ — shapes how I approach every integration.

16 new integrations - powered by AIready Low Code Plugins

Today marks a big milestone in our mission to bring more data, more context, and more visibility into a single, unified view. We’re excited to announce 16 brand‑new integrations, extending the range of data sources you can connect with just a few clicks. But the integrations themselves are only half the story.

Dashboarding Azure: SquaredUp vs Grafana

If you’re looking for a dashboarding solution today, chances are you’ve looked at Grafana or SquaredUp — or both. Grafana is a popular open source dashboarding tool with on-prem and cloud variants, while SquaredUp is the SaaS, cloud-based unified dashboarding solution. Both offer a comprehensive list of data sources that they can plug into and build dashboards. As such, they both also offer an integration with Azure - which is the focus of our discussion today.

A new perspective on dashboard sprawl

Dashboards are supposed to answer questions, not create more of them. But investigations don't stop at a single view. The moment you want to understand one specific thing in detail like a failing VM, a degraded service, a slow pipeline, dashboards start to break down. You end up either building yet another dashboard or searching through many different ones. SquaredUp's Perspectives changes this.