November-December 2019 Product Updates
Two months in one! We’re wrapping things up for the year, but wanted to give you all an update on all the great things we’ve shipped in the closing of 2019.


Two months in one! We’re wrapping things up for the year, but wanted to give you all an update on all the great things we’ve shipped in the closing of 2019.
Ignoring noisy and external errors is important to understanding the health of your client-side applications. Third-party scripts, user extensions, content crawlers, and non-impactful errors create lots of noise in web operations. With TrackJS Ignore Rules, you can filter out this noise and and have a clear view of your web application quality.
We’ve got a big update about to launch for Ignore rules, but we still had some time to improve the little things last month. Here are all the things we launched.
Do you work with an app that’s a dumpster-fire of errors? Wishing for an appropriate alert when you need to fight down the flames? Look no further friend. Today, we’re creating a Dumpster fire notification for your JavaScript errors with Particle and TrackJS. My friend Kristina is a wizard with hardware and LEDs. Awhile back, she made the dumpster fire to present at a conference, and she printed an extra one for me!
Today, we’re releasing TrackJS Global Error Statistics to the public. This aggregated production data is a useful measure of the state of client-side JavaScript errors and the quality of the web. We break it down by the most common errors, browsers, and operating systems. We did this a few years ago with the State of Client-Side JavaScript Errors. It was quite useful, but very time consuming to produce.
.NET Profilers are a developer’s best friend when it comes to optimizing application performance. They are especially critical when doing low level CPU and memory optimizations. But did you know that there are three different types of profilers? All are very valuable but serve relatively different purposes and different types of performance profiling. Let’s explore the different types.
Debugging performance issues in production can be a pain and, in some cases, impossible without the right tools. Java profilers have been around forever, but the profilers most developers think about are only one type: standard JVM profilers. However, using one type of profiler is not enough. Suppose you’re analyzing your application’s performance. There are multiple profiling activities which you may execute.
It’s remarkable to me how many developers have no idea what their time is worth. I speak with a lot of developers, and when I mention my work on TrackJS, I frequently hear “I could build that”. Yeah, you could. Observability tools aren’t rocket science. But you shouldn’t. Your time is too valuable to build better mousetraps. Your time is valuable and finite. Both to you and to your company.
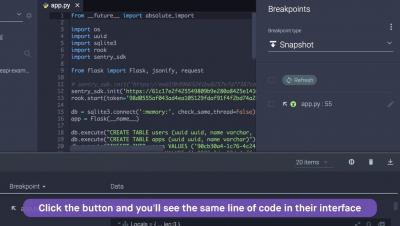
In our Sentry for Data series, we explain precisely why Sentry is the perfect tool for your data team. The present post focuses on how we used Sentry to make debugging Apache Beam easier (and faster). Since its creation, Sentry has embraced a single vision: help all developer teams build the best software, faster. We want to give developers the information they need to resolve issues quickly, without having to dig through noisy log lines.