Operations | Monitoring | ITSM | DevOps | Cloud

Introducing always-on production profiling in Datadog

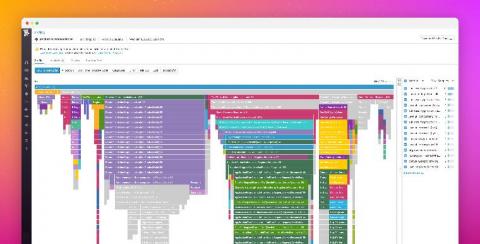
To complement distributed tracing, runtime metrics, log analytics, synthetic testing, and real user monitoring, we’ve made another addition to the application developer’s toolkit to make troubleshooting performance issues even faster and simpler. Today, we’re excited to introduce Profiling—an always-on, production profiler that enables you to continuously analyze code-level performance across your entire environment, with minimal overhead.

Debugging a Segfault in Rust

In case you missed our pair programming session about how to run, crash, and debug a Native application using Sentry, worry not! Our artificial intelligence Richard — much more intelligent than it thinks — has used its special powers to upload a recording of our session. This time, we chose a very special victim: Symbolicator. That’s the service responsible at Sentry for processing native crash reports.

Powerful Ignore Rules for Noisy JavaScript Errors

Ignoring noisy and external errors is important to understanding the health of your client-side applications. Third-party scripts, user extensions, content crawlers, and non-impactful errors create lots of noise in web operations. With TrackJS Ignore Rules, you can filter out this noise and and have a clear view of your web application quality.

A Dumpster-Fire Alert for Your JavaScript Errors

Do you work with an app that’s a dumpster-fire of errors? Wishing for an appropriate alert when you need to fight down the flames? Look no further friend. Today, we’re creating a Dumpster fire notification for your JavaScript errors with Particle and TrackJS. My friend Kristina is a wizard with hardware and LEDs. Awhile back, she made the dumpster fire to present at a conference, and she printed an extra one for me!

The Ongoing State of JavaScript Errors

Today, we’re releasing TrackJS Global Error Statistics to the public. This aggregated production data is a useful measure of the state of client-side JavaScript errors and the quality of the web. We break it down by the most common errors, browsers, and operating systems. We did this a few years ago with the State of Client-Side JavaScript Errors. It was quite useful, but very time consuming to produce.

List of .Net Profilers: 3 Different Types and Why You Need All of Them

.NET Profilers are a developer’s best friend when it comes to optimizing application performance. They are especially critical when doing low level CPU and memory optimizations. But did you know that there are three different types of profilers? All are very valuable but serve relatively different purposes and different types of performance profiling. Let’s explore the different types.

Java Profilers: Why You Need These 3 Different Types

Debugging performance issues in production can be a pain and, in some cases, impossible without the right tools. Java profilers have been around forever, but the profilers most developers think about are only one type: standard JVM profilers. However, using one type of profiler is not enough. Suppose you’re analyzing your application’s performance. There are multiple profiling activities which you may execute.