Operations | Monitoring | ITSM | DevOps | Cloud
WLSDM
How to Investigate Oracle WebLogic Server by a Large Monitor and WLS Console Utility WLSDM.
Throughout the vastness of the utilities of the Oracle WebLogic Server console extensions, there is the one that is especially useful — WLSDM, as the authors themselves position it — a monitoring utility for WebLogic Server with the largest set of features. If you go to the developer’s site, you can see that there is another powerful tool nearby, but it’s for a fee.
Advanced WebLogic Monitoring: JMX MBean Tutorial
This tutorial is prepared for Advanced WebLogic Administration and Automation. Setting up internal JMX MBean objects are the “best and ultimate practice” for application monitoring infrastructure.
Oracle WebLogic Server Slow Traces & Profiling, HTTPClient Outbound Call and Callback DevOps Actions
WHY WLSDM?
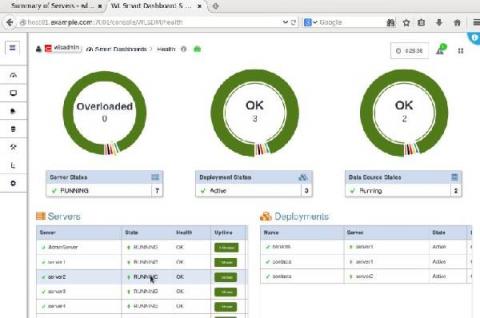
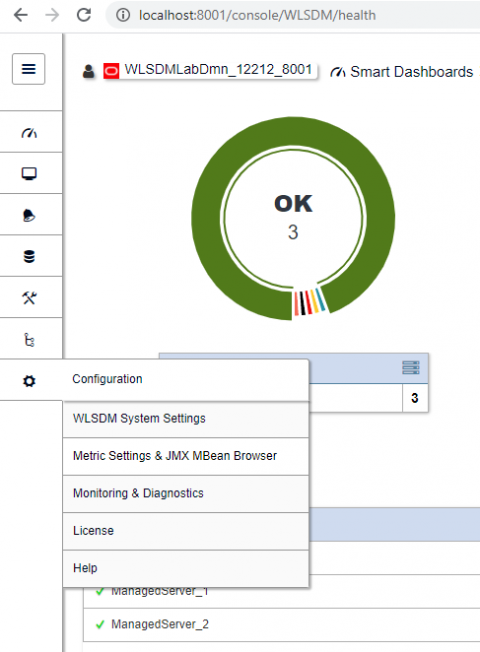
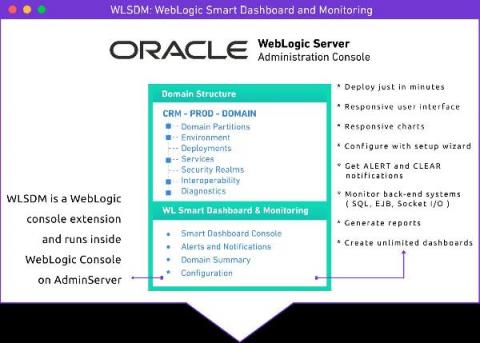
WLSDM is an enterprise “WebLogic console extension” which enables monitoring for WebLogic JMX MBean metrics and all the WebLogic domain assets (Health, Servers, Applications, Data Sources, JMS… etc.). It is very easy to create alarm and notification definitions by using WLSDM metric browser. WLSDM can store any WebLogic metric value historically and also can generate graphical reports.


