Operations | Monitoring | ITSM | DevOps | Cloud

Circonus

How Safe is Your Home's Air? The Internet of Things and Air Quality Monitoring during Wildfires

Over the past few weeks, the Camp Fire in Northern California and the Woolsey Fire in Southern California have devastated people and property. There has been tragic loss of life in the town of Paradise, and California’s firefighters remain tasked, once again, with the difficult job of containing and extinguishing the flames. What no one can contain, though, is the spread of hazardous wildfire smoke.

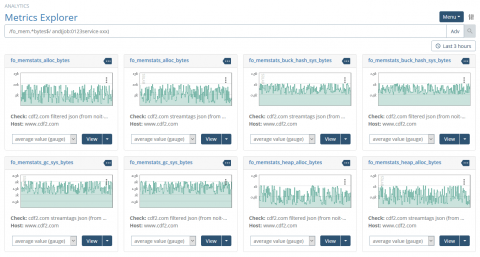
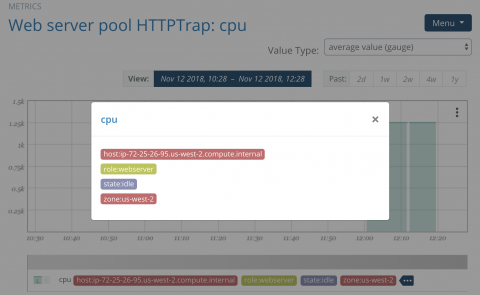
Introducing Circonus Stream Tags

A “metric” is a measurement, or value, representing the operational state of your system at a given time. For example, the amount of free memory on a web host, or the number of users logged into your site at a given time. Factor in hundreds (or thousands) of hosts, availability zones, hardware batches, or service endpoints, and you’re suddenly dealing with a significant logistical challenge.

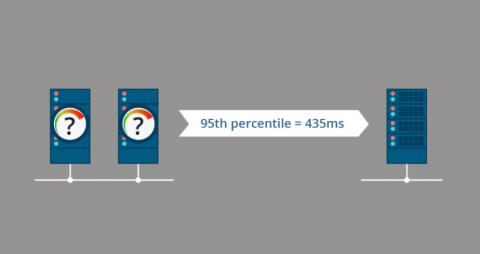
The Problem with Percentiles - Aggregation brings Aggravation

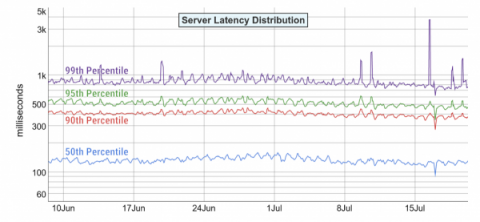
Percentiles have become one of the primary service level indicators to represent real systems monitoring performance. When used correctly, they provide a robust metric that can be used for base-of-mission critical service level objectives. However, there’s a reason for the “when used correctly” above.

A Guide to Service Level Objectives, Part 3: Quantifying Your SLOs

As we’ve discussed in part one and part two of this series, Service Level Objectives (SLOs) are essential performance indicators for organizations that want a real understanding of how their systems are performing. However, these indicators are driven by vast amounts of raw data and information. That being said, how do we make sense of it all and quantify our SLOs? Let’s take a look.

Quantifying WordPress Performance Improvements with circonus-logwatch

Deriving meaningful insights from third-party logs has always been a difficult yet necessary task. Most analysis occurs after-the-fact, when something has gone wrong. Very few tools allow real-time monitoring of logs, so SREs have become accustomed to backfilling log data into various analysis tools. Postmortem log analysis is the de facto standard, yet should it be? Why shouldn’t you be able to monitor your server logs in real-time?

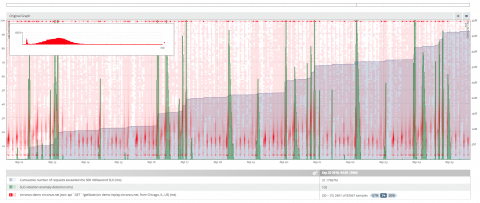
A Guide To Service Level Objectives, Part 2: It All Adds Up

Statistical analysis is a critical – but often complicated – component in determining your ideal Service Level Objectives (SLOs). So, a “deep-dive” on the subject requires much more detail than can be explored in a blog post. However, we aim to provide enough information here to give you a basic understanding of the math behind a smart SLO – and why it’s so important that you get it right.

Monitoring DevOps: Where are we now? [Infographic]

Our first DevOps & Monitoring Survey was conducted at ChefConf 2015. This year, we’ve created an infographic based on the facts and figures from our 2018 Monitoring DevOps Survey. The infographic provides a visual representation of the prevalence of DevOps, how monitoring responsibilities are distributed, metrics usage, and various aspects of current monitoring tools.

A Guide To Service Level Objectives, Part 1: SLOs & You

Four steps to ensure that you hit your targets – and learn from your successes. Whether you’re just getting started with DevOps or you’re a seasoned pro, goals are critical to your growth and success. They indicate an endpoint, describe a purpose, or more simply, define success. But how do you ensure you’re on the right track to achieve your goals?