Operations | Monitoring | ITSM | DevOps | Cloud

February 2023

Implementing Distributed Tracing in a Java application

Monitoring and troubleshooting distributed systems like those built with microservices is challenging. Traditional monitoring tools struggle with distributed systems as they were made for a single component. Distributed tracing solves this problem by tracking a transaction across components. In this article, we will implement distributed tracing for a Java Spring Boot application with three microservices.

OpenTelemetry Nginx Tutorial - Instrument and visualize traces

OpenTelemetry is an open-source standard for instrumenting cloud-native applications for generating different types of telemetry data. A robust observability framework set up using OpenTelemetry can help tremendously while troubleshooting software in production. Nginx is one of the most widely adopted web servers. Most often, nginx is used as a reverse proxy. It serves the frontend or backend applications behind the reverse proxy.

Observability vs Monitoring - The difference explained with an example

Observability vs monitoring has been a common topic in DevOps recently. There has been a lot of debate, and I have learned a lot from them when I started my observability journey. Most literature on observability is associated with a particular product or shares a textbook definition. In this blog post, I want to give you a practical understanding of observability and the differences between observability and monitoring with different scenarios and examples. We will cover the following topics here.

Loki vs Prometheus - Differences, Use Cases, and Alternatives

Loki and Prometheus are both open source tools. While Loki is a log aggregation tool, Prometheus is a metrics monitoring tool. Loki’s design is inspired by Prometheus but for logs. This blog post compares the two common monitoring tools Loki vs Prometheus, to help you understand their key differences. Log management and metrics monitoring are critical aspects of monitoring a software system effectively.

Complete Guide on Docker Logs [All access methods included]

Docker logs play a critical role in the management and maintenance of containerized applications. They provide valuable information about the performance and behavior of containers, allowing developers and administrators to troubleshoot issues, monitor resource usage, and optimize application performance. By capturing and analyzing log data, organizations can improve the reliability, security, and efficiency of their containerized environments.

Guide on Structured Logs [Best Practices included]

Structured logging is the method of having a consistent log format for your application logs so that they can be easily searched and analyzed. Having structured logs allows for more efficient searching, filtering, and aggregation of log data. It enables users to extract meaningful information from log data easily. Logging is an essential aspect of system administration and monitoring. Logging allows you to record information data about the application's activity.

Winston Logger - Full tutorial with a sample Nodejs application

Winston Logger is one of the most popular logging libraries for Node.js. It is designed to be a simple and universal logging library supporting multiple modes of transport. A transport is essentially a storage device for the logs. Each logger can have multiple modes of transport configured at different levels. For example, one may want error logs stored in a database, but all logs output to the console or a local file. Some of the features of Winston logger are.

Advanced filtering capabilities, Logs performance benchmark, and front page of HN - SigNal 21

Welcome to our first monthly product newsletter of 2023, SigNal - 21! Last month, we worked closely with our users to ship some advanced features which will enable our users to take advantage of their observability data more effectively. We were also trending on the front page of hacker news and got featured as one of the fastest-growing open source startups. Let’s dive in to see what humans at SigNoz were up to in the month of January 2023.

Variable Chaining in Dashboards Demo - SigNoz

With variable chaining, you have more granular control over charts in the Dashboards tab of SigNoz. It lets you filter specific views based on your use cases quickly. More about SigNoz: SigNoz - Monitor your applications and troubleshoot problems in your deployed applications, an open-source alternative to DataDog, New Relic, etc. Backed by Y Combinator. SigNoz helps developers monitor applications and troubleshoot problems in their deployed applications. SigNoz uses distributed tracing to gain visibility into your software stack.

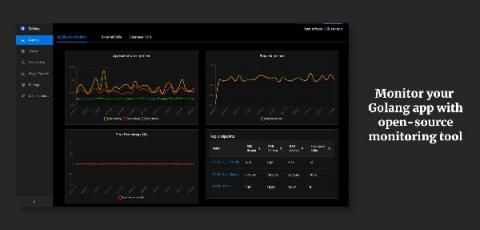
How to set up Golang application performance monitoring with open source monitoring tool - SigNoz

In this article, learn how to setup application monitoring for Golang apps using an open-source solution, SigNoz. If you want to check our Github repo before diving in 👇 Scalability, Reliability, Maintainability... The list goes on for the benefits of microservices architecture in today's world. But along with these benefits also comes the challenges of complexity.