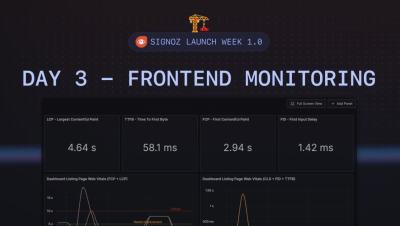
Operations | Monitoring | ITSM | DevOps | Cloud

February 2024

Top 13 Open Source APM Tools [2024 Guide]

Choosing the right APM tool is critical. How do you know which is the right one for you? Here are the top 13 open source application performance monitoring(APM) tools which can solve your monitoring needs. Open source APM tools have added benefits over their SaaS counterparts. Open source tools are more transparent as you can verify its source code, and you can use it without going through the pains of taking approvals usually required for using a third-party vendor tool.

Monitoring Kafka with OpenTelemetry including client side monitoring

In this video, you will see a demo of how to monitor Kafka with OpenTelemetry. We will instrument a NodeJS application using Kafka and get client side metrics like delay between producer emitting a message to consumer receiving it via distributed tracing. We will also get Kafka server metrics like consumer lag and plot it dashboards.

DataDog vs New Relic - The Real Winner [2024 Guide]

Both DataDog and New Relic are popular monitoring tools that provide a wide range of products covering different aspects of application and infrastructure monitoring. In this post, I have compared Datadog and New Relic on important features like APM, log management, infrastructure monitoring, OpenTelemetry support, etc. info 💡 I instrumented a sample Spring Boot Application and sent data to Datadog and New Relic to evaluate my experience.

Latest Top 11 Observability Tools in Spotlight - 2024's Guide

In microservices architecture, observability tools enable you to create central dashboards to gauge the health of your distributed systems. New age observability tools have shifted to providing quick workflows to debug application issues. In this post we will explore top 11 observability tools that you can consider to use for your software systems. In today's digital economy, distributed architectures have become the norm.

Latest Top 11 Log Monitoring Tools [Includes Open-Source]

For any software company, a log monitoring tool is a must for collecting, storing, and providing a centralized view of all logs from different applications and hosts for faster anomaly detection, incident resolution, and troubleshooting. They can also help detect security threats and provide audit trails. They are effective in capacity planning, decision-making, and ensuring optimized performance.

OpenTelemetry Flask Instrumentation Complete Tutorial

In this article, we will use OpenTelemetry to instrument a sample Flask app for traces. Flask is one of the most popular web application frameworks of Python. It consists of Werkzeug WSGI toolkit and Jinja2 template engine. Instrumentation is the biggest challenge engineering teams face when starting out with monitoring their application performance. OpenTelemetry is the leading open-source standard that is solving the problem of instrumentation.

Monitoring apps based on Falcon Web Framework with OpenTelemetry

Falcon is a minimalist Python web API framework for building robust applications and microservices. It also compliments many other Python frameworks by providing extra reliability, flexibility, and performance. Using OpenTelemetry, you can monitor your Falcon applications for performance by collecting telemetry signals like traces. Instrumentation is the biggest challenge engineering teams face when starting out with monitoring their application performance.

The Top 9 Dynatrace Alternatives & Competitors in 2024

Are you looking for a Dynatrace alternative? Then you have come to the right place. In this article, we will go through the top 9 Dynatrace alternatives. First, let's briefly discuss what Dynatrace offers and why you might consider other solutions. Dynatrace is a leading observability and application performance management (APM) platform, providing deep insights into application performance and reliability.

Livestream: Client side monitoring & metrics for Kafka using OpenTelemetry & SigNoz

In this livestream, we will walk through a demo of how to get client side insights from Kafka using distributed tracing. We will take a NodeJS producer and consumer setup communicating via Kafka to show how one can instrument this with OpenTelemetry, and get metrics from a client perspective. We will also touch on getting Kafka metrics using OpenTelemetry receivers.

Monitoring Django application performance with OpenTelemetry

Django is a popular open-source python web framework that enables rapid development while taking out much of the hassle from routine web development. It also helps developers to avoid common security mistakes. As such, many applications are built with Django. Django is very popular among web developers and has a huge community behind it. It gives web developers ready-to-use components for common things that you will need to accomplish for a web application.

Latest top 17 API monitoring tools [open-source included]

Choosing the right API monitoring tool is critical. How do you know which is the right API monitoring tool for you? Here are the top 17 API monitoring tools, including open source tools for API performance monitoring. In this article, we will review the top 17 API monitoring tools which you can use for monitoring your APIs. But first, let’s have a brief overview of APIs.

Grafana vs Splunk - Key Features and Differences

Grafana and Splunk are both used as monitoring tools. But while Grafana is majorly used as a data visualization tool, Splunk is an enterprise security and observability platform. Monitoring tools are essential for any business that wants to have visibility into its IT infrastructure. They provide real-time data that can be used to identify and troubleshoot problems. Grafana and Splunk are two of the most popular monitoring tools on the market. So, which one is better for your business?

DataDog vs Prometheus - Comprehensive Comparison Guide [Updated for 2024]

Both DataDog and Prometheus are application monitoring tools aimed to improve application performance. While Datadog is a cloud-based SaaS solution, meaning there's no need to install or maintain any infrastructure, Prometheus is an open-source tool that requires manual download and installation on your infrastructure. Let us compare DataDog and Prometheus to see which tool suits The biggest difference between Datadog and Prometheus is that while Prometheus is open-source, Datadog is proprietary.

OpenTelemetry Nestjs Tracing Implementation Guide [2024 Updated]

Nestjs is a Nodejs framework for building scalable server-side applications with typescript. It makes use of frameworks like Express and Fastify to enable rapid development. It has gained wide popularity in recent times, and many applications are making use of the Nestjs framework. Using OpenTelemetry client libraries, you can monitor your Nestjs application. Monitoring your Nestjs application is critical for performance management.

Spans - a key concept of distributed tracing

Spans are fundamental building blocks of distributed tracing. A single trace in distributed tracing consists of a series of tagged time intervals known as spans. Spans represent a logical unit of work in completing a user request or transaction. Distributed tracing is critical to application performance monitoring in microservice-based architecture. Before we deep dive into spans, let's have a brief overview of distributed tracing.

Kibana vs. Grafana - A Scenario-Based Decision Guide [2024]

Both Kibana and Grafana are data visualization tools providing users capabilities to explore, analyze and visualize data with dashboards. The difference between Kibana and Grafana lies in their genesis. Kibana was built on top of the Elasticsearch stack, famous for log analysis and management. In comparison, Grafana was created mainly for metrics monitoring supporting visualization for time-series databases.

Top 14 ELK alternatives [open source included] in 2024

ELK is the acronym Elasticsearch, Logstash, and Kibana, and combined together, it is one of the most popular log analytics tools. Elastic changed the license of Elasticsearch and Kibana from the fully open Apache 2 license to a proprietary dual license. The ELK stack is also hard to manage at scale. In this article, we will discuss 14 ELK alternatives that you can consider using.

A Lightweight Open Source ELK alternative

ELK is the acronym Elasticsearch, Logstash, and Kibana, and combined, it is one of the most popular log analytics tools. Elastic changed the license of Elasticsearch and Kibana from the fully open Apache 2 license to a proprietary dual license. The ELK stack is also hard to manage at scale. SigNoz can be used as a lightweight alternative to the ELK stack.

Monitoring your FastAPI application with OpenTelemetry

FastAPI is a modern Python web framework based on standard Python type hints that makes it easy to build APIs. It's a relatively new framework, having been released in 2018 but has now been adopted by big companies like Uber, Netflix, and Microsoft. Using OpenTelemetry, you can monitor your FastAPI applications for performance by collecting telemetry signals like traces. FastAPI is one of the fastest Python web frameworks currently available and is really efficient when it comes to writing code.

Latest Top 13 Distributed Tracing Tools [perfect for microservices]

Modern digital organizations have rapidly adopted microservices-based architecture for their applications. Distributed tracing tools help monitor microservices-based applications. Choosing the right distributed tracing tool is critical. How do you know which is the right one for you? In this post, we will cover the top 13 distributed tracing tools in 2024 that can solve your monitoring and observability needs.

A Practical Guide to Logging in Microservices [Includes Best Practices]

Microservices logging is the practice of tracking and recording the activities of specific services in a distributed microservices architecture. Logging is an important aspect of any software system, and it is more critical for a microservices architecture as there are many small, independent services interacting with each other.

16,000+ Github stars, New Design Theme & Front Page of HN - SigNal 33

Welcome to the first SigNal of 2024! It is a year that we’re looking forward to accomplishing great things. We recently crossed 16,000+ GitHub stars as we continue to be amazed by the support of the developer community in our mission of open-source observability. Let’s see what humans of SigNoz were up to in January 2024.