Operations | Monitoring | ITSM | DevOps | Cloud

March 2023

What do you see in the clouds?

Remember being a carefree kid? Laying down in a field on a warm spring day, gazing up at the sky, and imagining shapes in the clouds. Maybe you saw a lion or an elephant dancing across the sky. You felt grounded and safe, enjoying the breeze while listening to cheers from the football game in the distance. But could you see the rain forming on the horizon threatening to distort your animal shapes and send the football team running for cover?

Agent-based versus agentless data collection: what's the difference?

In the quest for a secure and reliable method to monitor their infrastructure, enterprises and service providers often find themselves exploring various agent-based and agentless solutions. Grasping the nuances between these two approaches is essential to select a monitoring service that aligns with your unique business requirements.

The Comprehensive Guide to SNMP

Simple Network Management Protocol (SNMP) provides a standard message format that devices being monitored and monitoring systems can all speak – even though they will be running different operating systems. SNMP is the most widely deployed management protocol; it is simple to understand (although not always to use), and enjoys ubiquitous support.

Comprehensive Kubernetes Observability with LogicMonitor's Kube-State-Metrics Integration

With the growing popularity of Kubernetes, the need for effective monitoring solutions has become crucial. LogicMonitor, a leading cloud-based monitoring and observability platform, has rolled out a new set of DataSources in its Kubernetes monitoring solution, LM Container, that uses data from the kube-state-metrics service to provide enhanced visibility into the state of Kubernetes objects.

The flexibility to meet you where you work: creating custom HTTP alert integrations with LogicMonitor

Not everyone on your team lives in LogicMonitor — some might never go into the platform! But that’s okay because LogicMonitor’s Alert Integrations are designed with extensibility in mind. LogicMonitor’s flexible approach to alerts ensures that you receive alerts in the place you work, alerts are routed to the right team member, and you are not overwhelmed by alert storms or alert fatigue.

How do IT issues affect workplace morale and productivity?

Employee morale can make the difference between a struggling company and one that’s thriving and growing. High levels of engagement and enthusiasm amongst the workforce happen at organizations run like a well-oiled machine. Each department works hand in hand with the other, with everyone working toward the same goal. Even though all parts of a company are responsible for a strong company spirit, IT issues have a powerful impact.

How Are SASE and SD-WAN Related?

SD-WAN and SASE both build on traditional network models, such as those used to connect a company’s offices. While the two models share some features and advantages, they have different structures and approaches. In the simplest terms, an SD-WAN inspects and routes data more efficiently, while a SASE combines networking and security functions into a single service. Here’s what you need to know.

What is Azure Stack HCI?

Azure Stack HCI is a virtualized workload solution from Microsoft that allows businesses to run Windows and Linux apps and services in a hybrid on-premise/cloud environment. Built on top of Windows Server, Azure Stack HCI is an example of hyper-converged infrastructure (HCI). This technology virtualizes conventionally hardware-defined systems like storage and networking to create flexible, efficient infrastructure solutions.

Monitoring Kubernetes Object Configuration with LogicMonitor

Kubernetes has emerged as the de facto standard for container orchestration in modern software development, allowing organizations to manage and scale containerized applications easily. As a highly dynamic and distributed system, however, Kubernetes can be challenging to manage and maintain at scale. One of the most critical aspects of maintaining a stable and secure Kubernetes cluster is monitoring the object configurations and tracking the changes over a period of time.

LM Logs query tracking: find what's relevant now to prepare for tomorrow

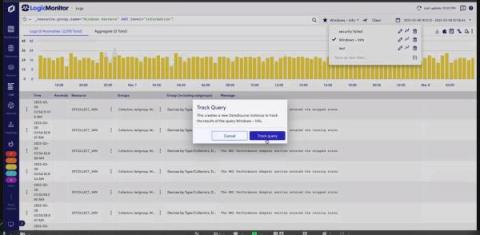
LM Logs offer intelligent log analysis with querying capabilities for all experience levels to analyze log data. But it’s most effective to know when to investigate deeper and conduct further analysis instead of trying to identify hidden trends in log data manually. The best way to determine what’s relevant now is to see if the amount of log data and message types produced in a device or service have drastically changed.

What is an ESXi cluster, and how do you cluster ESXi servers

ESXi clusters involve a combination of ESXi hosts, VMware services, and vCenter to optimize load balancing, availability, and resource management for virtual machines (VMs). These clusters feature a vCenter server that centralizes the management process to facilitate shared resources that drive higher availability, scalability, and load-balancing capabilities.

Implementing SLAs, SLIs, and SLOs: A guide to monitoring best practices

Implementing SLAs, SLIs, and SLOs is essential for effective monitoring and maintaining optimal system performance. As companies grow, they may add a significant number of KPIs that burden their IT assets, leading to system sluggishness and employee complaints. Developers must balance business needs with IT processes, and SLAs, SLIs, and SLOs can help them achieve this balance.

PostgreSQL vs. MySQL

PostgreSQL and MySQL are two of the most popular open-source databases available today. They both provide the database backend for an untold number of web applications, enterprise software packages, and data science projects. The two databases share some similarities in that they both adhere to the SQL standard. However, there are some key differences that might influence your decision to choose one over the other.

What are the 4 DORA metrics, and what do they mean for Ops teams?

Performance monitoring has become increasingly important for operations teams in today’s rapidly changing digital landscape. The DORA metrics are essential tools used to measure the performance of a DevOps team and ensure that all members work efficiently and collaboratively toward their goals. Here, we’ll explore what exactly DORA metrics are, how they work, and why companies should be paying attention to them if they want to set up an effective DevOps environment.

How are firewalls and SD-WAN related?

You might think that firewalls and SD-WAN are two completely unrelated technologies. However, integrating these innovations improves network availability, optimizes network performance, and adds an extra layer of security to your organization. Learn more about firewalls and SD-WAN and why you should combine them.