Operations | Monitoring | ITSM | DevOps | Cloud

October 2020

Benchmarking and sizing your Elasticsearch cluster for logs and metrics

With Elasticsearch, it's easy to hit the ground running. When I built my first Elasticsearch cluster, it was ready for indexing and search within a matter of minutes. And while I was pleasantly surprised at how quickly I was able to deploy it, my mind was already racing towards next steps. But then I remembered I needed to slow down (we all need that reminder sometimes!) and answer a few questions before I got ahead of myself.

How to perform incident management with ServiceNow and Elasticsearch

Welcome back! In the last blog we set up bidirectional communication between ServiceNow and Elasticsearch. We spent most of our time in ServiceNow, but from here on, we will be working in Elasticsearch and Kibana. By the end of this post, you'll have these two powerful applications working together to make incident management a breeze. Or at least a lot easier than you may be used to!

Running Elastic Cloud on Kubernetes from Azure Kubernetes Service

It's safe to say that It's safe to say that Kubernetes is the de facto standard for orchestrating containers and the applications running in them. As the standard, a variety of managed services and orchestration options are available to choose from. In this blog post, we're going to take a look at running the Elastic Stack on Azure Kubernetes Service (AKS) using Elastic Cloud on Kubernetes (ECK) as the operator.

How to connect ServiceNow and Elasticsearch for bidirectional communication

The Elastic Stack (ELK) has been used for observability and security for many years now, so much so that we now offer the two as out-of-the-box solutions. However, identifying issues and finding the root cause is only part of the process. Often, organizations want to integrate the Elastic Stack into their everyday workflows so they can resolve those issues quickly. This typically involves integrating with some form of ticketing/incident tracking framework.

Aggregate all the things: New aggregations in Elasticsearch 7

The aggregations framework has been part of Elasticsearch since version 1.0, and through the years it has seen optimizations, fixes, and even a few overhauls. Since the Elasticsearch 7.0 release, quite a few new aggregations have been added to Elasticsearch like the rare_terms, top_metrics or auto_date_histogram aggregation. In this blog post we will explore a few of those and take a closer look at what they can do for you.

Monitoring Elastic Cloud deployment logs and metrics

The ability to monitor your Elastic Cloud deployment is critical for helping ensure its health, performance, and security. Our Elastic Observability solution provides unified visibility across your entire ecosystem — including your Elastic Cloud deployments. Elastic Observability allows you to bring your logs, metrics, and APM traces together at scale in a single stack so you can monitor and react to events happening anywhere in your environment.

Elastic Contributor Program: How to submit and validate a contribution

Last month we launched the Elastic Contributor Program to recognize and reward the hard work of our awesome contributors, encourage knowledge sharing within the Elastic community, and build friendly competition around contributions. But how do you start contributing? In this blog post, we’ll walk through how to log in to the Elastic Contributor Program portal and set up your profile so you can begin submitting your own contributions and validating others’ contributions!

Add flexibility to your data science with inference pipeline aggregations

Elastic 7.6 introduced the inference processor for performing inference on documents as they are ingested through an ingest pipeline. Ingest pipelines are incredibly powerful and flexible but they are designed to work at ingest. So what happens if your data is already ingested? Introducing the new Elasticsearch inference pipeline aggregation, which lets you apply new inference models on data that's already been indexed.

Getting started with Elastic Workplace Search on Elastic Cloud

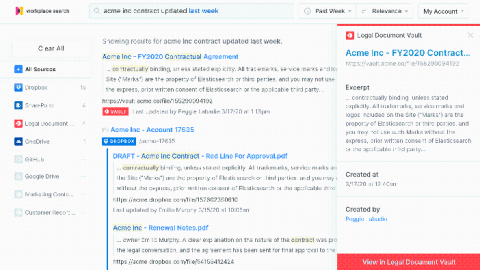
Chances are you already spent a big part of your day looking for a document, an email, or an answer that lies deep within a Google Slides presentation. Thankfully, you landed in the right place. With Workplace Search, finding the right information across all your cloud and on-premises data platforms is now easier than ever, and it’s a few clicks closer than you expect.

Investigative analysis of disjointed data in Elasticsearch with the Siren Platform

At Siren, we build a platform used for “investigative intelligence” in Law Enforcement, Intelligence, and Financial Fraud. Investigative intelligence is a specialisation of data analytics that serves the needs of those that are typically hunting for bad actors. Such investigations are the primary focus of law enforcement and intelligence, but are also critical to uncovering financial crime activities and for threat hunting in cybersecurity.

Monitoring Google Cloud with the Elastic Stack and Google Operations

Google Operations suite, formerly Stackdriver, is a central repository that receives logs, metrics, and application traces from Google Cloud resources. These resources can include compute engine, app engine, dataflow, dataproc, as well as their SaaS offerings, such as BigQuery. By shipping this data to Elastic, you’ll get a unified view of the performance of resources across your entire infrastructure from cloud to on-prem.

Gaining holistic visibility with Elastic Security

Let’s talk visibility for a moment. Security visibility is a data-at-scale problem. Searching, analyzing, and processing across all your relevant data at speed is critical to the success of your team’s ability to stop threats at scale. Elastic Security can help you drive holistic visibility for your security team, and operationalize that visibility to solve SIEM use cases, strengthen your threat hunting practice with machine learning and automated detection, and more.

Detecting DGA Activity in Network Data with Elastic ML - Oct 1, 2020 Elastic Stockholm Meetup

After infecting a target machine, many malicious programs need to communicate with a command & control server ( C & C) that is controlled by the malware author. In order to avoid detection and subvert defensive measures, malware authors employ domain generation algorithms (DGA), which enable the malware to generate hundreds or thousands of new domains, one of which is then registered by the malware author as the location of the C&C server.

Train, evaluate, monitor, infer: End-to-end machine learning in Elastic

Machine learning pipelines have evolved tremendously in the past several years. With a wide variety of tools and frameworks out there to simplify building, training, and deployment, the turnaround time on machine learning model development has improved drastically. However, even with all these simplifications, there is still a steep learning curve associated with a lot of these tools. But not with Elastic.