Operations | Monitoring | ITSM | DevOps | Cloud

July 2019

Worth a Look: More Public Grafana Dashboards

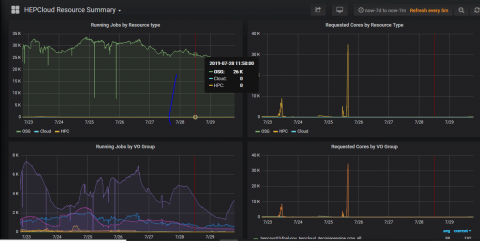
A couple months ago, we wrote about some Grafana dashboards that large organizations, for a variety of reasons, have made public with their actual live data. And we followed that up with a look inside the public dashboards at GitLab, a self-described “ridiculously transparent” company. It’s always interesting to see how Grafana users are setting up their visualizations, so we decided to do another roundup. Check these dashboards out, and get inspired.

Loki's Path to GA: Adding Structure to Unstructured Logs

Launched at KubeCon North America last December, Loki is a Prometheus-inspired service that optimizes storage, search, and aggregation while making logs easy to explore natively in Grafana. Loki is designed to work easily both as microservices and as monoliths, and correlates logs and metrics to save users money. Less than a year later, Loki has almost 6,500 stars on GitHub and is now quickly approaching GA.

How a Production Outage Was Caused Using Kubernetes Pod Priorities

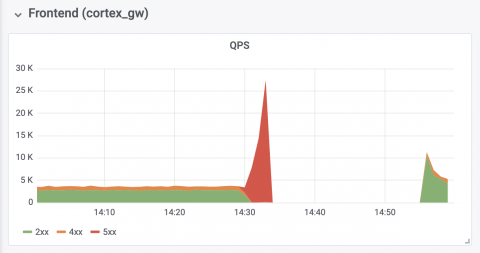
On Friday, July 19, Grafana Cloud experienced a ~30min outage in our Hosted Prometheus service. To our customers who were affected by the incident, I apologize. It’s our job to provide you with the monitoring tools you need, and when they are not available we make your life harder. We take this outage very seriously. This blog post explains what happened, how we responded to it, and what we’re doing to ensure it doesn’t happen again.

How the k6 Load Testing Tool Is Leveraging Grafana

Like Grafana Labs, my company, Load Impact, is built on open source. When we set out to build the k6 load testing tool, we knew we wanted to offer a purely open source stack. We’ve done performance testing for the better part of the past 15 years. When we looked at the market a couple of years ago, we saw a lot of both commercial and open source tools, and they were mostly either too simple or too complex. Additionally, there was nothing designed specifically for developers.

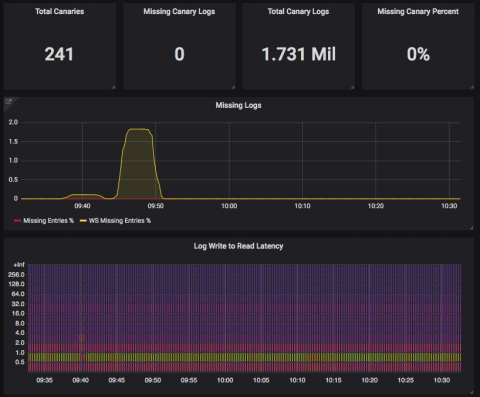
Loki's Path to GA: Loki-Canary Early Detection for Missing Logs

Launched at KubeCon North America last December, Loki is a Prometheus-inspired service that optimizes storage, search, and aggregation while making logs easy to explore natively in Grafana. Loki is designed to work easily both as microservices and as monoliths, and correlates logs and metrics to save users money. Less than a year later, Loki has almost 6,500 stars on GitHub and is now quickly approaching GA.

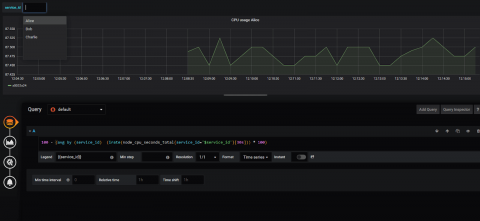
Ask Us Anything: How to Alias Dashboard Variables in Grafana in SQL

Recently a question came up from a customer, and I was surprised we didn’t have an easy answer for it: How can you translate some esoteric ID or serial number, such as fe03-s3-x883, into a user-friendly name such as “harry” or “alice”? In a regular templating language, it would be easy to do via a map file or similar, but to do this with Grafana is a little more complicated.

Coming Soon: Seamless and Cost-Effective Meta Tags for Metrictank

One of the major projects we’re working on for Metrictank – our large scale Graphite solution – is the meta tags feature, which we started last year and are targeting to release in a few months. A lot of people don’t realize this, but Graphite has had tag support for more than a year. Our mission with Metrictank is to provide a more scalable version of Graphite, so introducing meta tags was a logical next step.

Loki's Path to GA: Docker Logging Driver Plugin & Support for Systemd

Launched at KubeCon North America last December, Loki is a Prometheus-inspired service that optimizes storage, search, and aggregation while making logs easy to explore natively in Grafana. Loki is designed to work easily both as microservices and as monoliths, and correlates logs and metrics to save users money. Less than a year later, Loki has almost 6,500 stars on GitHub and is now quickly approaching GA.

Prometheus v2.11 Released

Since graduating within CNCF last August, Prometheus has adopted a new schedule for releases every six weeks. The latest release, v2.11, arrived on July 9. Prometheus 2.11 includes a new option to compress WAL records using Snappy, query performance improvements, the option to use Alertmanager API v2, and more. You can download the latest version here. prometheus_tsdb_wal_reader_corruption_errors is now renamed to prometheus_tsdb_wal_reader_corruption_errors_total.

Ask Us Anything: The Most Popular Grafana Community Questions Answered!

The Grafana Labs community has more than 600 developers around the world who contribute to our open source projects. From time to time, they also ask really great questions about how to get started in Grafana, how to solve an issue, or how to implement best practices for various functions. Here are three of the most popular questions on the Grafana community board right now – and the answers from Grafana team members and fellow developers.

What's New (and What's Next) in Prometheus

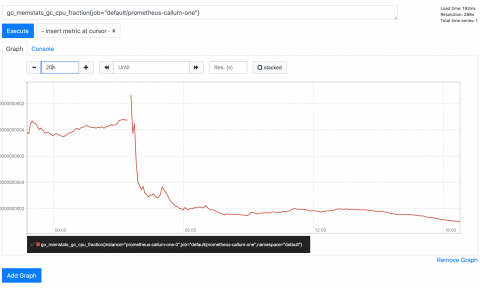
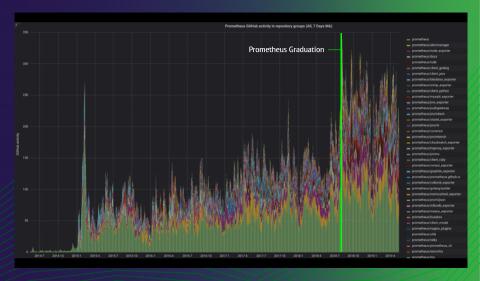
Björn “Beorn” Rabenstein, who recently joined Grafana Labs, is a longtime contributor to Prometheus. He recently gave talks at DevTalks Cluj and DevOpsCon Berlin about what’s been happening with the project since 2018, when it became the second project hosted by the Cloud Native Computing Foundation to graduate.

A Closer Look at Lazy Loading Grafana Dashboards

Lazy loading of dashboard panels has been a popular feature request from the Grafana community for many years, and it was finally added in v6.2. In previous versions, the moment you opened a dashboard Grafana will issue queries for every panel, even those you have to scroll to see. This can create high peaks in load to your data source backends. Meanwhile, you may never actually scroll down to look at all of those panels, so executing queries for those panels would have been pointless.

Inside Grafana Labs: Our Workspaces Revealed

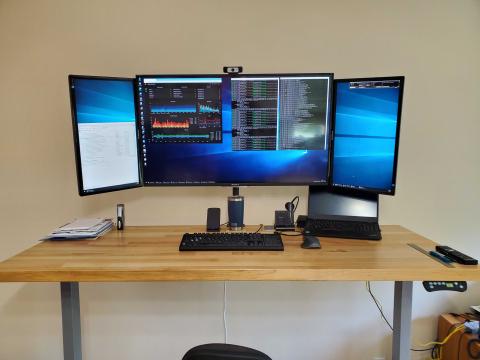
A post-geographical culture means more than putting a face to the name. Here, the Grafana Labs team is also putting a photo to the workspace. Check out the setups that have been where some of the latest Grafana releases and products have been developed. What you’ll learn is that not only is the Grafana Labs team adept at creating dashboards, supporting hosted services, and hosting conferences.

Pro Tips: How to Decrease MTTR and Increase Uptime with Grafana and VictorOps

We can sift through oceans of data. Alert on predetermined parameters. Deliver multiple commits a day. But as organizations leverage these layered, complex monitoring systems, “we also have to start practicing observability to enrich the actions that we take to solve problems as they occur and drive continual improvement,” said VictorOps Product Marketing Manager Melanie Postma. VictorOps is one tool that can help accomplish that.

Pro Tips: How Amgen Manages On Calls (and Burnout) with Grafana

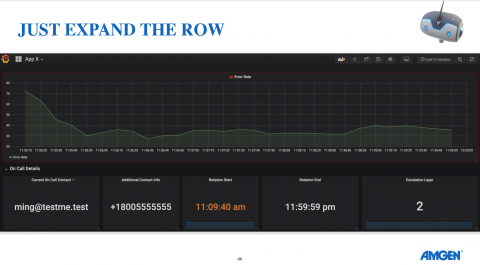
There is a lot of talk about graphing all the things, but have you ever considered graphing all the people – in particular their on calls – as well? “Not letting people burnout on call is something that is being talked about in the industry,” said Jordan J. Hamel, Design Engineer at the biotech company Amgen.