Operations | Monitoring | ITSM | DevOps | Cloud

Meet Rosetta

During an incident, the answers an engineer needs are spread across tools. Telemetry sits in one place, configurations in another, and tickets in a third. Building a complete picture means knowing which tool holds which piece and how to query each one, usually under time pressure. Rosetta is the conversational interface for Selector Foundry, the agentic NetOps platform built on Selector’s existing AIOps and Observability solution.

How Configuration Monitoring Helps Detect Zero-Day Activity

Last updated: October 9, 2026 A zero-day vulnerability may be unknown, but its effects often are not. Exploitation can leave behind observable changes: a new privileged account, an altered management setting, an unexpected file, a modified access rule, or configuration drift from an approved baseline. That makes zero-day configuration monitoring an important part of a defense-in-depth strategy.

Top Tips: Staying productive during a slow work week

Top tips is a weekly column where we highlight what’s trending in the tech world and share ways to stay ahead. This week, we’re looking at what you can when you’re having a slow-paced, less hectic workweek. We’ve all been there at intermittent intervals of our jobs: You check into the office right after the weekend only to realize you’re having one of those slow, relatively low-pressure weeks. So what do you do to stay productive?

How AI agents help teams deliver better digital experiences

The moment your page slows down, two clocks start. One is yours: time to alert, time to investigate, time to fix. The other belongs to the user staring at the slow page. Yours is measured in minutes. Theirs runs out in seconds. That gap is what AI agents close. Zia Agents in OpManager Nexus detects an issue, works out the cause, and runs the fix on its own, often before your users feel a thing. This blog looks at how that changes the experience you deliver.

Event Intelligence and the Diagnosis Gap: When Logs Are the Only Witness

✓ operational truth Incident diagnosis is now the longest phase of resolution because evidence is fragmented, expertise sits with a few people, and cloud and SaaS estates no longer allow engineers to log in and look. Event Intelligence closes the gap by correlating events into a single probable cause, mining logs automatically, and arriving at the incident with a hypothesis already formed.

Claude Opus pricing in 2026: every model, every rate, and whether it's worth it

Claude Opus pricing is $4 per million input tokens and $20 per million output tokens on Claude Opus 5.5, the current model, with cache reads at $0.20 and batch jobs at $2/$10. Opus 5 and the legacy 4-series bill at $5/$25. The 1M context window carries no surcharge. Every Opus model Anthropic shipped in 2026 held the same line: $5 in, $25 out, per million tokens. Opus 4.6 in February, 4.7 in April, 4.8 in May, Opus 5 in July. Four releases, one price. On September 22, 2026, the line broke.

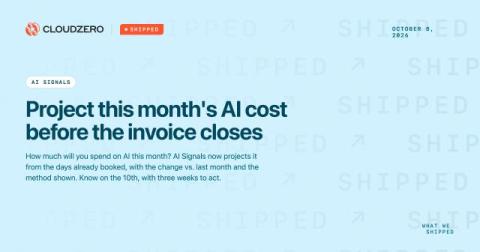
Shipped: Project this month's AI cost before the invoice closes

The question comes up on the 10th, the 15th, and again on the 25th. Where is AI spend going to end up this month? The invoice won’t tell you until it’s closes, and by then there’s nothing left to forecast. “If I’m looking at this on the 15th, I want to know where we’re going to land.” That’s how a finance lead put it during a persona session in September, and it’sthe whole job. You have half a month of real usage behind you.

Reducing Android scope-sync overhead in Sentry Flutter

Our SDK adds work to the app that installs it. It records recent app activity as breadcrumbs and keeps user information and other diagnostic data up to date. Changes to that information are called scope updates. On Android, we send those updates to a worker isolate, which passes them to the Sentry Android SDK. We found that the calling isolate and the worker both normalized the same data. The encoding step also created a JSON string and an extra byte buffer that we could avoid.

Run incident response in your FedRAMP High environment

Earlier this year, Datadog for Government achieved FedRAMP High certification, extending our GovCloud environment (US1-FED) to the federal government’s most sensitive civilian workloads. That certification now covers Datadog Incident Response, bringing paging, incident coordination, automation, and postmortem workflows into US1-FED. When a government system goes down, responders need to reach the right people, coordinate a fix, and keep stakeholders informed.

Define user actions on your web app with visual labeling in Product Analytics

Adding or renaming a product event has traditionally meant creating an engineering ticket. Datadog Product Analytics uses the same SDKs and configuration as Real User Monitoring (RUM), and those SDKs autocapture actions such as clicks and taps. But an automatically generated action name describes the element rather than the user intent behind it.