The latest News and Information on Monitoring for Websites, Applications, APIs, Infrastructure, and other technologies.
We recently launched several new Cloud Monitoring features to improve your visualization and troubleshooting experience.
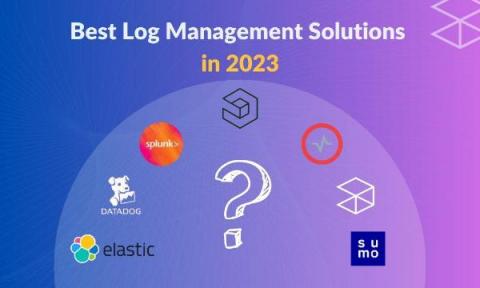
Log Management tools are crucial for the security and performance of your IT infrastructure. With the right log management system, you can quickly detect and respond to any anomaly or performance issue. Presently, there are numerous log management platforms. Each with its own unique set of features and benefits. While most of these platforms offer industry-standard capabilities, what sets them apart from each other are the stand-out features, pricing, and overall user experience.
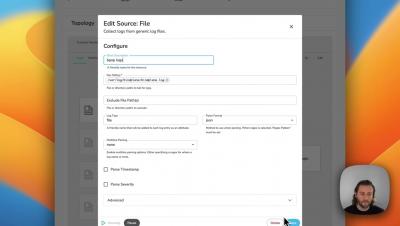
If you work with large amounts of log data, you know how challenging it can be to analyze that data and extract meaningful insights. One way to make log analysis easier is to normalize your log messages. In this post, we’ll explain why log message normalization is important and how to do it in Graylog.
Today, businesses and organizations rely heavily on metrics and analytics to make informed decisions. Metrics are important whether you’re a developer, a marketer, or the head of a company. One type of metric that is widely used is a time-series metric. Time-series metrics provide insights into how data changes over time. With time-series data, businesses can track trends, detect anomalies, and make predictions.
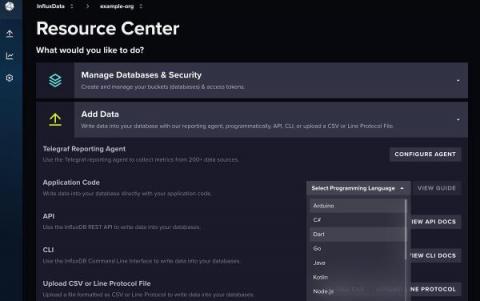
InfluxDB 3.0 is a versatile time series database built on top of the Apache ecosystem. The 3.0 product suite includes two cloud-based versions: InfluxDB Cloud Serverless, and InfluxDB Cloud Dedicated. For the purposes of this post, InfluxDB Cloud refers to these specific versions of InfluxDB. This post provides an update on the status of the client libraries for InfluxDB Cloud, as well as all the available resources to get started querying and writing data to InfluxDB.