Docker containers generate logs to monitor their operations, but without a mechanism in place to manage these logs, they can grow indefinitely, leading to excessive disk space consumption and performance degradation. Implementing docker log rotation is crucial to control log file size and quantity, ensuring efficient log management and optimal system performance.
Monitoring Windows event and activity Logs is one of the most important aspects of Windows log management. Windows Event Logs contain all the crucial information about system health, security events, application and errors which helps in gaining insight into your operating system.
Learn how Selector’s Log Analytics simplifies log management by enabling direct ingestion from various sources, including network, infrastructure, cloud, and applications. With real-time analysis, it filters and clusters log data, detects anomalies, and surfaces actionable insights automatically. Explore how users can select specific time periods, search and filter logs easily with intuitive controls. Using Named Entity Recognition (NER), Selector extracts key metadata from logs for searching and correlation with other telemetry.
Streamline manufacturing by unifying IT and OT systems with Splunk. Secure, monitor, and troubleshoot your entire operation to boost productivity, reduce risk, and increase uptime.
Enterprise data and analytics is a fast-evolving field in enterprise IT, where new technologies and solutions are creating revolutionary ways to extract insights from data. To keep pace with these changes and drive value creation through data analytics initiatives, organizations must be willing to adopt innovative solutions, embrace new and emerging best practices, and move beyond obsolete or outdated methods that are no longer effective. Our blog post this week is all about transforming your enterprise data architecture to elevate your data management and analytics capabilities.
Rust has claimed the title of ‘most desired programming language’ for the past 8 years in a row in StackOverflow’s annual developer survey. The language was created less than 20 years ago, yet when users work with Rust, they always seem to want to work with it again. This consistent growth in popularity has, in part, driven the need for effective monitoring practices, particularly Rust tracing.
When telemetry data (collected from system sources in observability) is analyzed collectively it provides insights into the relationships and dependencies within a distributed system. OpenTelemetry standardizes the collection and transmission of telemetry data to backend platforms, closing visibility gaps by offering a unified instrumentation format across all services.
GenAI promises evolutionary changes in how we use observability tools, but meeting expectations means heeding the lessons of our AIOps mistakes. The emergence of generative AI in observability tools was inevitable, but there’s already been an extreme degree of hype in the market. Monitoring, DevOps and ITOps have never been immune to trends, and with GenAI capabilities, the propagandahype machine is running out of control.
Achieving modern observability with a unified data platform and Search AI If you have a love-hate relationship with your data, we don’t blame you. It’s generated at high velocity and from all sides — your apps, endpoints, networks, and servers. By 2025, global data creation is projected to grow by more than 180 zettabytes.* Inside this wealth of data lies better operational resilience, profitability, and innovation.
While data lakes make it easy to store and analyze a wide variety of data types, they can become data swamps without the proper documentation and governance. Until you solve the biggest data lake challenges — tackling exponential big data growth, costs, and management complexity — efficient and reliable data analytics will remain out of reach.
What is the purpose of query logging in MySQL? Why is it important? How do you enable and configure it? In this article, we will address these questions and more. You will find a detailed guide on how to use mysqldumpslow to analyze slow query logs, along with tips on harnessing convenient GUI tools like dbForge Studio for MySQL to your advantage.
Monitoring Apache logs is crucial to ensure the health, security, and performance of web servers running the Apache HTTP Server software. Analyzing these logs continuously will, in turn, provide invaluable insight into web server activities related to web traffic patterns, user behavior, server errors, potential security threats, and performance metrics.
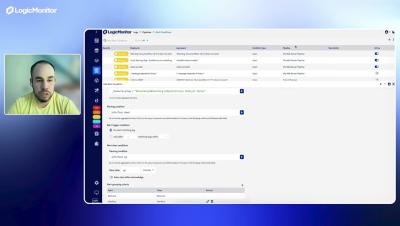
In this demo, discover how LogicMonitor Envision's anomaly detection helps your IT team stay ahead of issues before they escalate. By analyzing every log event, Envision identifies and marks new patterns as anomalies, ensuring your team is notified when something unusual happens. This capability, combined with unified logs and metrics, provides the context you need to make faster, smarter decisions about your network's performance and health.
OpenTelemetry, OTel, is an incredible open-source observability framework that helps you collect, process, and export trace data. It's super valuable for engineers who want to understand their systems better. At the heart of this framework lies the OpenTelemetry Collector, a pivotal component that turns raw traces into useful metrics. Let’s explore the importance of the OpenTelemetry Collector and show you how it makes it easier for engineers to make sense of data.
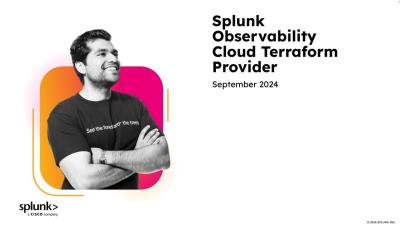
In this video I will demonstrate how to use the Splunk Terraform Provider. I’ll explain what it is and why you should use the Splunk Terraform Provider as part of your overall Observability as Code solution. Using a simple Terraform project, I will walk you through the setup of the provider and the creation of a Detector in Splunk Observability Cloud.
In the original post in this series, we discussed the benefits of adopting Workspaces within your Cribl Cloud organization to create isolated Cribl instances for your clients. This time around, we’re going to look at how Cribl Edge can smooth the edges of your security operations. Sorry, I had to say it. I’ll see myself out.
Log analysis tools are essential for organizations of all sizes. This guide provides an in-depth analysis of the top 10 log analysis tools in 2024. It compares their features, pricing models, and integration capabilities to assist you in making an informed decision based on your specific requirements.
As your data continues to grow and time remains critical, making data-driven decisions has never been more important (and let’s face it, that’s no small feat). Luckily, our new Scheduled Reporting feature is here to help—automatically delivering your logs, metrics, and tracing data in visually-rich custom dashboards, exactly when you need them, directly to the inboxes of your chosen recipients.
As organizations modernize their applications and deliver more complex, cloud-based services, the traditional boundaries between DevOps, SecOps, and ITOps are disappearing. Seamless collaboration between these teams, often referred to as DevSecOps, has become essential for efficiently addressing both reliability and security challenges.
Since the release of ChatGPT in November 2022, companies have either banned or rushed to adopt generative artificial intelligence (GenAI), which is rapidly expanding in use and capabilities. Its powerful yet unpredictable nature poses significant cybersecurity risks, transforming it into a double-edged sword. However, whether generative AI poses more opportunity or risk is not necessarily the right question to ask.
With the upcoming release of JDK 23, there are some significant changes in locale information that will affect Elasticsearch and how you ingest and format datetime data. Firstly, a bit of background.
Telemetry data, at its core, is all about transmitting real-time information from remote sources to centralized systems for analysis and action. This data is super important across different industries due to its ability to provide immediate, actionable insights that enhance operations and strategic decision-making.
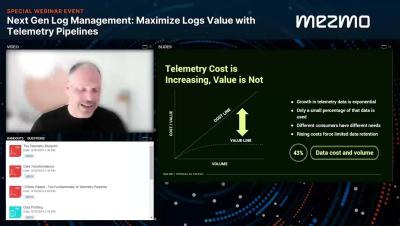
In today’s fast-paced digital landscape, enterprise data stands as both a critical asset and a potential liability. With data volumes expanding at an annual rate of 28% while budgets increase by only 7%, organizations face mounting challenges. The unpredictable nature of data value complicates decisions on what to store and where. Moreover, the rise of connected devices and evolving security threats further exacerbate the situation.
In today's digital-first, cloud-native world, effective log management is crucial. It enhances software quality, operational efficiency, and the customer experience. However, with the rise of distributed and microservices-based architectures, organizations now generate petabytes of log data daily, making analysis and storage increasingly challenging.
Zabbix is an open-source monitoring solution designed for real-time monitoring and management of IT infrastructure, including networks, servers, virtual machines, and cloud services. Whilst Zabbix is a powerful monitoring tool that can be utilized for a range of use cases, the solution is primarily used for network monitoring.
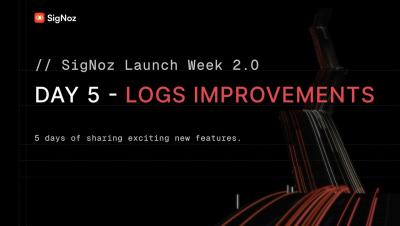
It is the last day of SigNoz Launch Week 2.0, and we’re excited to announce improvements in the logs module of SigNoz. Searching and filtering for logs to debug issues is one of the top critical workflows any developer uses. We have gathered feedback from our users and shipped some important features that focus on speeding up log searches, refining the filtering process, and enhancing the overall log analysis experience.
Calling all Splunk Cloud Platform admins! At Splunk, we are constantly working to improve the way we service our customers. We understand that maintenance windows, while necessary, can sometimes be impactful to your operations. That is why we’re excited to announce a significant upgrade to our maintenance experience, designed to provide you with greater control and minimal impact.
Here are all the components of Loki explained so that you can figure out how many instances of each you need for a resilient Loki deployment. Senior Developer Advocates Jay Clifford and Nicole van der Hoeven talk you through what each component does and which ones are optional.
The OpenTelemetry Collector is a powerful tool for processing different types of telemetry data, such as metrics, traces, and logs, all in one place. This is important because traditional observability tools often require separate toolchains, which can be inconvenient and inflexible when changes are needed.
If you use the programming language C# there’s a chance that you’re already familiar with.NET (pronounced ‘dot net’), an open-source application platform supported by Microsoft. C# is the programming language for.NET but the platform can run programs written in multiple languages. Microsoft’s ambition with.NET is to offer developers one platform to solve any problem.
We hear it often—data volumes are growing at a 28% compound annual growth rate (CAGR) year over year, and organizations struggle to manage it all. With no additional money in their budgets, they can’t afford to store more and more data in their SIEM, which in most cases means being uncompliant or, worse, not having older data readily available in the case of a recently discovered breach. I’ve repeatedly heard that the data they have archived is practically inaccessible.
Learn about Sumo Logic's New "Unified Experience" UI bringing a new consolidated and optimized experience to the Sumo Logic web interface. All Sumo Logic products are now directly available through the same tab menu, with greater performance and features.
One challenge for the widespread adoption of telemetry pipelines for SRE teams within an organization is knowing where to start when building a pipeline. Faced with a wide assortment of sources, processors, and destinations, setting up a telemetry pipeline can seem like trying to build a Lego set without any instructions. The solution is to provide teams with pre-defined components that provide specific functionality, that they can then use to build pipelines that meet their own requirements.
Alerts that you receive from your observability tool are based on conditions that existed seconds to minutes in the past, because the alert is only triggered after the data has been indexed within the tool. This means that your ability to take timely action in response to the condition is significantly limited, and often your window of opportunity to react is past by the time you receive the alert.
It’s 10:00 p.m. on a Sunday when my 9th grader bursts into my room in tears. She says she doesn’t understand anything about algebra and is doomed to fail. I jump into supermom mode only to discover I don’t remember anything about high school math. So, I do what any supermom does in 2024 and head to ChatGPT for help. These generative AI chatbots are amazing. I quickly get a detailed explanation of how to solve all her problems.
SigNoz provides logs, metrics, and traces under a single pane of glass. Correlation of these signals is a big part of our ongoing efforts. During this launch week, we're excited to announce that we have shipped the first version of it, which allows you to correlate logs with infrastructure metrics and APM metrics with logs.
The OpenTelemetry project is changing how organizations approach observability. It aims to standardize monitoring across different systems. OpenTelemetry—commonly referred to as OTel—provides APIs, SDKs, exporters, and collectors. It is making data collection, analysis, and utilization more efficient, leading to better decision-making and technology adoption.
Streamline your log replication and analysis with Dataflow! Learn to build real-time pipelines that capture, process, and analyze logs from any source. See examples like detecting IoT sensor anomalies, responding to e-commerce traffic spikes, or mitigating security threats. Watch and discover how Dataflow integrates with different logging tools to empower you with real-time insights and build a truly scalable and resilient log analysis solution.
The Splunk Platform allows you to build third-party applications to deliver innovation at scale for enterprise. Watch this video to learn how and get started on building and growing your developer identity!
Remember the Tabs vs. Spaces arguments? It seems that observability has grown up enough that we are arguing over which signals are the “best” signals for observability. Often referred to as the Pillars of Observability, Metrics, Logs, and Traces (sometimes adding Events for MELT) each provide a unique perspective on a system. What happens when we change our perspective from finding the “best” telemetry format to finding the telemetry that aligns with the problems we need to solve?
In an increasingly digital world, organizations face complex challenges in managing their security data that’s growing at a relentless pace. With the rapid growth of cyber assets and the ever-present threat of sophisticated attacks, legacy security tools often struggle to keep up.
tldr: This post discusses how to measure CDN request locality without indexing a single log. The function of a CDN is to bring cacheable data, like pictures & videos, physically closer to your customers. This reduces latencies, and load on your backend servers. When measuring CDNs, there are some very common metrics.
Chaos Monkey is an open-source tool. Its primary use is to check system reliability against random instance failures. Chaos Monkey follows the testing concept of chaos engineering, which prepares networked systems for resilience against random and unpredictable chaotic conditions. Let’s take a deeper look.
Just as every organization should have a business plan, every organization should also have an IT strategy that supports that business plan. This article offers an overview of what an IT strategy is, what it does for an organization, and the key components that should go into an IT strategy.
Most engineers will tell you this: Troubleshooting today feels like trying to find your way out of a wild jungle, in the middle of a storm, at night, while a countdown clock is running. In other words, it’s ambiguous, nerve-racking, and plain difficult. But should this be the norm?
When DNS Says: Talk to the Hand! What? This started with a post on social media, which created a discussion among us industry professionals. The following conversation happened when I got to talk to my coworkers about some interesting things regarding DNS responses. Putting us gearheads in a room always results in an interesting comment or two!
Debugging Python code is crucial for guaranteeing the uptime and performance of your application, and logging in Python is a great solution to streamline your debugging workflow. Python, a general-purpose programming language, includes a logging module in its standard library, offering a flexible framework for generating log messages from Python programs.
Are you looking for a way to increase your AIOps signal to noise ratio and get more value from your data? In this article we will explore how one can utilize OpenTelemetry’s collectors, processors and data models to add or enhance classification attributes. These attributes can help you use your AIOps tools more efficiently and derive more value from your current data.
Splunk ITSI is an AIOps solution that correlates and applies machine learning to all data for real-time, predictive performance monitoring and integrated IT management workflows. This enables teams to prevent incidents before they impact the business, and detect, respond and resolve incidents all from one place.
In this Community Call, Senior Software Engineer Christian Haudum talks to us about bloom filter changes for Grafana Loki, including the deprecation of the bloom compactor and a pivot towards creating bloom filters for structured metadata. Bloom filters are a probabilistic data structure that we're using to improve query performance in Loki. Community Calls are monthly meetings that are open to everyone interested in the development of Loki. They are an opportunity for software engineers working on Loki to discuss new features as well as for open-source users of Loki to ask questions.
Our blog covers practical insights into Golang logging, including how to use the log package, popular third-party libraries, and tips for structured logging.
Filebeat is a straightforward log shipper that enables you to begin logging, rapidly. With observability solutions like Logit.io, this can be achieved in as little as 5 minutes, following our integration guide. To understand more about using Filebeat with Logit.io, this article will define what it is, how it works, and how to integrate Filebeat with Logit.io to ship logs from local files to one or more destinations.
The latest LM Studio 0.3 update has made Elastic’s AI Assistant for Security run with an LM Studio-hosted model easier and faster. In this blog, Elastic and LM Studio teams will show you how to get started in minutes. You no longer need to set up a proxy if you work on the same network or locally on your machine.
This is one of a series of blog posts that explain how the Cribl SRE team builds, optimizes, and operates a robust Observability suite using Cribl’s products. If you haven’t, we encourage you to read the previous blog about how the Cribl SRE team uses our own products to achieve scalable observability. We installed Cribl Edge on the machines we manage for our users and use it to gather metrics.
While “America runs on Dunkin”, IT increasingly runs on Linux. Between being open-source and highly customizable, everything from video games to enterprise servers can run on Linux. When cloud services took over the corporate IT environment, they brought Linux with them in the form of virtual servers and containers. Meanwhile, developers increasingly use Linux-based Docker to containerize applications and Kubernetes to manage the deployments.
Node.js is an open-source runtime environment, frequently used for backend development, and enables developers to build scalable, high-performance apps that can easily handle a vast amount of simultaneous connections. The solution is suitable for network applications scalable for real-time web apps, RESTful APIs, microservices, and chat apps.
In a perfect world, there wouldn’t be any errors or bugs in production applications. However, we don’t live in a perfect world, and from experience, you know there is no such thing as a bug-free application. If you are using the Laravel framework, you can leverage its log tracking and error logging to catch bugs early and enhance the performance of your Laravel-based application.
Working at Coralogix, a leading full-stack observability platform, I recently faced an interesting challenge. The team I am part of is building the DataPrime query language and query engine, used to easily query logs and other observability data on the platform, usually in the form of Parquet files on AWS S3. Inside the engine, our DataPrime queries are transformed into query plans with SQL-like expressions, for example in filters.
If The Notorious BIG – the artist behind the iconic song "Mo Money Mo Problems" – had been an IT operations engineer, he might instead have labeled his hit "Mo Clouds Mo Problems." Why? Because the more clouds you have to manage and monitor, the more problems you're likely to run into.
Observability has become essential for efficient system management, and OpenTelemetry is leading the way in this field. The OpenTelemetry Collector Contrib is an important tool for gathering telemetry data, providing developers and IT professionals with a flexible and powerful way to manage observability. We want to help you learn how to set up the OpenTelemetry Collector Contrib. We'll point out common issues and offer effective troubleshooting strategies.
As more and more applications are delivered daily, it’s becoming increasingly difficult for teams to onboard and manage them manually. To keep up with this demand, many teams are embracing automation in application delivery and management, with Kubernetes being a popular tool of choice. While Kubernetes’ scalability helps manage application infrastructure sprawl, there is still a need to collect data from the applications directly and from Kubernetes to monitor the growing beast itself!
Managing Docker container logs is essential for debugging and monitoring application performance. Tailoring Docker logs allows for real-time insights, quick issue resolution, and optimized performance. This guide focuses on efficient methods for tailing Docker logs, with clear examples and command options to streamline log management.
Java is a popular programming language, developed almost 30 years ago by Sun Microsystems, based on the main theory of ‘write once, run anywhere’ (WORA). Due to Java having been around for a long time, numerous learning resources are available for new developers which further adds to its popularity. Also, Java code can operate on any underlying platform like Windows, Linux, iOS, or Android without rewriting.
In this video I’ll walk through the steps to instrument a PostgreSQL database using the Automatic discovery and configuration feature of the Splunk OpenTelemetry Collector. We’ll use an install script to install and run the Collector with discovery mode on a Linux machine where the database is running. I’ll then show you how to properly configure the PostgreSQL receiver properties so that the Collector is able to connect and authenticate to the database. Once the Collector is successfully configured, I’ll show you how to view those metrics in Splunk Observability Cloud.
Exciting news: it’s now possible to build a custom distribution of the OpenTelemetry Collector and remotely manage it with BindPlane. Though not all of BindPlane’s capabilities are available when managing a custom distribution (yet), it’s #prettycool, as it cracks open the door for teams looking to BYOF (bring your fleet), and manage them with our OTel-native telemetry pipeline.
Linux is an open-source operating system kernel originally created in 1991. It has a reputation for being versatile, stable, and secure, hence its wide use on computing devices, beginning from servers and mainframes down to desktop computers, smartphones, and embedded devices. The broad uses for Linux and its popularity have led to the demand for effective monitoring.
Network infrastructure is the hidden glue between servers. In AWS, it takes skill, knowledge and experience to build a network that can be monitored, will perform and is secure. A key source of information to determine the health of a network is the logs, but network logs suffer from a serious problem. They’re noisy, and they’re often difficult to parse, but by leveraging indexless observability, Coralogix customers can drive insights from data that would previously have been untouchable.
Crontab logs are records of scheduled tasks (or "cron jobs") that are executed by the cron daemon on Unix-like operating systems such as Linux. These logs provide details about the tasks that have been run, when they were executed, whether they completed successfully, and any errors or issues that occurred during their execution. This detailed guide will cover all aspects of crontab logs, from fundamental concepts to advanced strategies for optimization.
Keeping smooth and safe operations now relies entirely on observability. But as there's more and more data to keep track of, the costs are going up. This makes it hard for your companies to balance how well things are running and their budgets. OpenTelemetry can help by making a standard way to collect and process all the data. We're going to share how OpenTelemetry can save you money on observability and why having too much data can be costly.
Logstash serves as a real-time event processing engine within the OpenSearch ecosystem, which comprises OpenSearch, Beats, and OpenSearch Dashboards. Logstash acts as a centralized pipeline that collects data from numerous sources before forwarding it to OpenSearch.
Developed in the mid-1990s, Ruby is a dynamic, open-source programming language. The tool has grown in popularity from its initial release, having been used in modern systems covering a variety of corporate and academic use cases. Ruby gained further traction after the release of Ruby on Rails, a powerful web application framework written in pure Ruby.
Last time we spoke, I told you about our (then) brand-spankin’-new OTel over HTTP implementation, in both our OpenTelemetry Source and Destination. That was a little over a year ago, also known as a lifetime in tech! I wanted to take another opportunity to speak to you and introduce some of our new OpenTelemetry features, and share how you can put them into practice!
Observability is undergoing a massive shift as enterprises drive adoption of modern technologies, including cloud and microservices, along with disruptive technologies, such as generative AI (GenAI). To keep pace with the complex requirements of the modern tech stack, operations teams need to consider and adopt next-generation observability. Splunk users are often challenged by using products that provide fragmented observability, hampering their ability to modernize their environments.
Activate a world of possibility with Search AI. Elastic powers AI to give you real-time, forward-thinking flexibility. When data turns into action, you don't have to wait for the world to turn. You can drive it's motion. With Elastic's search AI you can unleash the possibilities of your data. And transform your world.
Once upon a time, we thought “Log everything” was the way to go to ensure we have all the data we needed to identify, troubleshoot, and debug issues. But we soon had new problems: cost, noisiness, and time spent sifting through all that log data. Enter log analysis tools to help refine volumes of log data and differentiate signal from the noise to reduce mental toil to process. Log beast tamed, for now….
Redundancy and resiliency are both important factors for keeping things running smoothly in many industries. For example: Even small businesses, like home-based operations or mom-and-pop shops, should think about redundancy and resiliency to avoid disruptions in their day-to-day work. While researching for this article in my home office, my internet service went out and stayed out for a couple of hours.
With more organizations becoming tech-enabled to tackle the AI boom, a new term has emerged: the fusion team. At least 84% of companies and 59% of government entities have set up “fusion teams," according to Gartner data. A new concept coined by Gartner, the fusion team aims to encourage collaborative development among technology and business teams. But what exactly is a fusion team, and why is it becoming increasingly important in today's business landscape?
Discover how financial services leaders build digital resilience amid security threats and compliance challenges. Learn strategies to enhance your security posture, drive growth, and meet customer expectations in uncertain times. Featuring insights from IDC and Splunk experts.
Once upon a time, we thought “Log everything” was the way to go to ensure we have all the data we needed to identify, troubleshoot, and debug issues. But we soon had new problems: cost, noisiness, and time spent sifting through all that log data. Enter log analysis tools to help refine volumes of log data and differentiate signal from the noise to reduce mental toil to process. Log beast tamed, for now….
Imagine living in a world without caller ID, which is easy if you grew up in the “late 1900s.” Every time someone called, you had a conversation that followed this pattern: Hi! Who’s this? It’s Jeff! Hi Jeff! How’s it going? Today, most people already know who’s calling when they answer the phone because caller ID is built into smartphones and communications apps. As a developer, your Python logging is your application’s caller ID.
As applications grow in complexity, the ability to gather, process, and analyze logs becomes crucial for maintaining system health and troubleshooting issues. Two popular open-source log collectors have emerged as frontrunners in this space: FluentD and FluentBit. But how do you choose between them? This article dives deep into the FluentD vs FluentBit debate, exploring their features, performance, and use cases to help you make an informed decision.
We are excited to announce the launch of Elastic's Support Assistant. This blog takes you through a tour of our latest generative AI tool and some common scenarios where it can help with your own use of Elastic technology.
Docker is a popular platform that enables developers to package, distribute, and run applications within isolated environments called containers. Logs play an important role in the use of Docker for numerous reasons. For example, The running of Docker containers in isolation makes it difficult to handle troubleshooting issues and monitor application behavior effectively in the absence of detailed logging.
Designed in the early 1990s Python was built to emphasize code readability and on the principle that there should be one way to do things. Python is one of the most popular programming languages and is utilized for a range of purposes including machine learning, web applications, and data analysis.
AWS MediaTailor provides a wealth of information via metrics, but one key feature that is very difficult to track is the Transcoding performance. What is transcoding and why is performance important?
Modern enterprises are more dependent than ever on data. That's why it's more important than ever for organizations to ensure that their data is accurate, reliable, and easily accessible. Data observability is a modern method that helps achieve this. It involves real-time monitoring of data to detect unusual patterns. By doing so, it ensures data quality and reliability, which boosts operational efficiency and governance.
In this video I’ll introduce you to the Chrome DevTools Recorder and how you can use it with Splunk Observability Cloud’s Synthetic Monitoring feature. I’ll explain what the Recorder is and then demonstrate how you can create a recording. We’ll then export the recording and upload it as a new browser test in Splunk’s Synthetic Monitoring feature. After uploading, I’ll walk through the test results and explain when it makes sense to use the Recorder for your Synthetic Monitoring tests.
Centralizing logs (arranging all records in one place) is often challenging as we need to decide whether to use a log shipper or directly log from the application. If you are not familiar with a log shipper, logging directly from the library might be a suitable option for development (it is easy to configure). However, in production, you'll likely want to use one of the available log shippers, mainly due to buffers, since blocking the application or dropping data (immediately) may not be an option.
Data is wealth. Extracting insights from data is valuable for any organization—data aids in making informed decisions, optimizing operations and costs, and understanding how customers behave. However, reaping the benefits of data requires an investment in the right tools, resources, and people — something smaller organizations may not have the means to do.
System logging protocol, abbreviated as Syslog, is a standard protocol used for message logging. Put simply, it is a standard for collecting and storing log information. A Syslog server collects, parses, stores, examines, and dispatches log messages from devices including routers, switches, firewalls, Linux/Unix hosts, and Windows machines.
Learn how to cut IT observability costs with OpenTelemetry. We'll cover ways to streamline data collection, reduce hidden expenses, and optimize data management. Discover practical tips for handling telemetry data efficiently, avoiding vendor lock-in, and improving system performance. Watch this video for actionable insights and real-world examples of using OpenTelemetry to manage costs effectively.
With the continual rise of website applications and cloud-based microservices effective API monitoring has become crucial. APIs outline the methods and data formats that applications can utilize to request and exchange information. They allow developers to access the functionality of a software component or service without needing to comprehend its internal workings.
Serilog offers users a streamlined logging framework for.NET applications and cloud services. The tool enables users to adjust logging levels, enrich log events with additional properties, and switch between different sinks without modifying the application code. The simplicity of Serilog, its support of structured logging, and compatibility with asynchronous applications and systems are a selection of the tool's features that have led to it being commonly used across a variety of organizations.