CFEngine 3.17.0a1-termux - better Android Termux Support
As a follow up to my previous “personal policy” blog I have exciting news: An improved CFEngine is available for Termux!


As a follow up to my previous “personal policy” blog I have exciting news: An improved CFEngine is available for Termux!
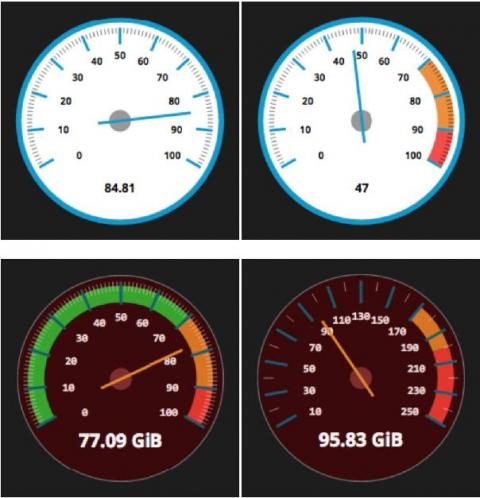
One thing we believe at Grafana Labs is that your data should be presented in a way that makes sense to you. Since the release of Grafana v7.0, we’ve seen a lot more developers taking advantage of the new plugins platform, which helps them build high-quality custom plugins faster than ever.
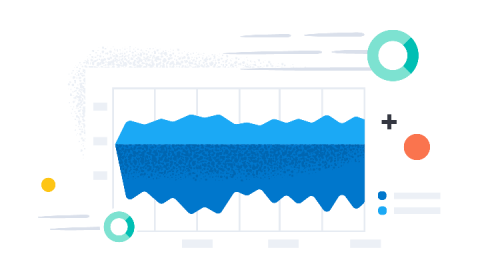
Higher resolution metrics are critical for monitoring dynamically changing environments and rapidly changing application metrics. Examples where high resolution metrics are critical include high volume e-commerce, live streaming, autoscaling bursty workloads on Kubernetes clusters, and more. Higher resolution custom, Prometheus, and agent metrics are now generally available, and can be written at a granularity of 10 seconds. Previously these metric types could only be written once every 60 seconds.
As a network of microservices changes and grows, the interactions between them can be difficult to manage and understand. That’s why it’s handy to have a service mesh as a separate infrastructure layer. A service mesh is an approach to solving microservices at scale. It handles routing and terminating traffic, monitoring and tracing, service delivery and routing, load balancing, circuit breaking and mutual authentication.
We are rapidly approaching the six-month mark of the COVID-19 global pandemic and expect to be living with its effects for the foreseeable future. While our Ribbon business has not been immune from this once in a lifetime public health crisis, together we have managed it very effectively and kept our customers first! This is largely due to the extraordinary efforts of our people, along with the quick actions and decisions we took to change our work model and carefully manage expenses.
In today’s economy, digital assets (applications, data, and processes) determine business success. Cloud-native applications are designed to iterate rapidly, creating rapid time-to-value for businesses. Organizations that are able to rapidly build and deploy their applications have significant competitive advantage.
For our Cube module we use the ROLLUP SQL query to fetch all data from the database and then make a tree data structure out of the given result. This is how we make it a lot easier to render cubes dynamically.
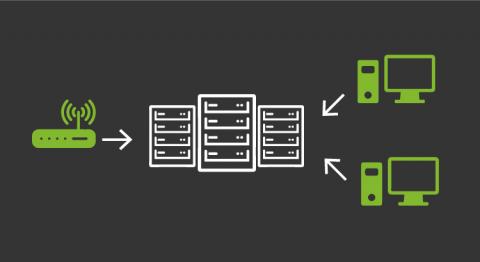
As network technology evolves, the SNMP world evolves with it. They create new network hardware that contains more and more OIDs to be able to stay updated on the status of more details of the product. This entails the need to automate the way to control every detail, doing it through the use of SNMP trap monitoring. An SNMP trap is a message sent by an SNMP device to a configurable IP address when there’s a change or an event on the device.
In our blog post on structuring Elasticsearch data with grok on ingest for faster analytics, we took a look at how to structure unstructured data on ingest (schema on write) to make sure your analytics run at near real time. Speed like that can help take your observability use cases to the next level. In this article, we’re going to build on what we learned by incrementally creating a new grok pattern from scratch!
This is the second in a three-post series themed around Ops-led DevOps, where I explore the relationship between observability and a set of software delivery lifecycle practices that support the adoption of DevOps principles and the transition from project to product centric ways of working. I started with Site Reliability Engineering, here I consider Value Stream Management (VSM) and I will finish with Continuous Delivery. Defining VSM Forrester defines VSM as.