Operations | Monitoring | ITSM | DevOps | Cloud

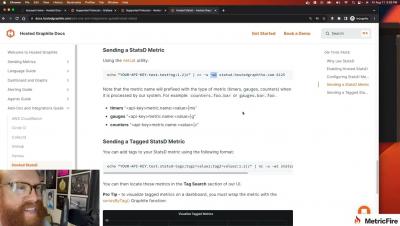
MetricFire's CLI Tool: Easy Monitoring & Automation!

Looking for a powerful way to send and visualise metrics from the command line? Meet HG CLI, MetricFire’s official command-line tool! In this video, we’ll show you how to install, configure, and use HG CLI to manage your Hosted Graphite metrics and create dashboards, all without having to configure an agent yourself. Whether you're a DevOps engineer, SRE, or developer, this tool will streamline your monitoring workflows! Don't forget to like, subscribe, and hit the bell for more MetricFire insights!

How to install Telegraf on Hosted Graphite with MetricFIre

Learn how to install and use MetricFire Telegraf in this tutorial. Telegraf is a collector agent for metrics and events from systems. Telegraf allows you to collect metrics from multiple systems and visualize the data in various ways. This Telegraf tutorial will walk you through the installation process and show you how to use the tool to collect metrics and events from systems. This is a great way to monitor your systems and track the performance of your applications in real time.

MetricFire - Dashboards Tutorial

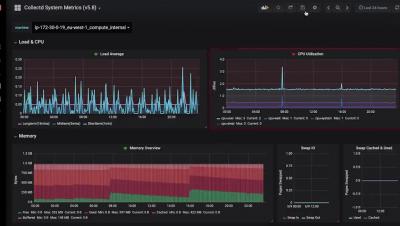
In this video, we explore MetricFire’s powerful dashboarding platform. Discover how to customize your dashboard to view the metrics that matter most to your business. With a variety of visualization options and an intuitive interface, creating and editing charts, tables, and graphs has never been easier. Share your dashboard with your team and keep everyone on the same page. Join MetricFire and start tracking your business metrics today.