Operations | Monitoring | ITSM | DevOps | Cloud

The Place Where Modern Operations & Technology Come Together


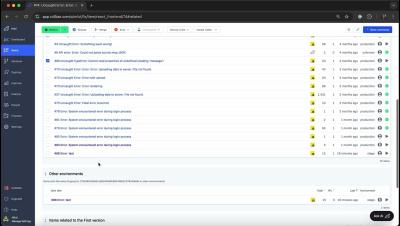
Learn how to use the enhanced related items tab in Rollbar to speed up debugging.
The Related Tab is a helpful tool that shows you other items related to the one you’re looking at. This makes it easier to see if the same issue is happening in different parts of your code base or if there are similar items that might be connected. Knowing this can help you understand if a problem is widespread or if there are other occurrences that could help you debug it quicker.
WSL2 for Firmware Development
This guide provides instructions for setting up an environment for developing, debugging, and programming embedded systems firmware in the Windows Subsystem for Linux (WSL2). WSL2 provides a convenient and stable Linux development environment for working on embedded systems firmware. If you’re curious about toolchain performance, check out this comparison of firmware development environments, but the summary is that WSL2 is about 2x the speed of Windows and similar to “bare metal” Linux.

The secrets to building secure and scalable OTA update systems and infrastructure with Nick Sinas
François and Chris are joined by Nick Sinas, CTO at Ovyl, to share their experience building OTA update systems for embedded and IoT devices.

Capacity Management: Debugging Exceeded Rate Limits
Snuba, the primary storage and query service for event data that powers Sentry in production, has historically been doing rate limiting under the hood, making it hard to discover and increasing time to resolve customer support requests. This is not something you’d know the specifics of unless you were deep in the Snuba code. But as we triage support questions from customers, one issue tends to pop up: RateLimitExceeded. You got tired of not getting query results.

Debugging Python with VS Code and Sentry
Sentry is committed to helping developers fix broken code quickly and effectively. In this article, we’ll cover a range of intermediate to advanced techniques for debugging Python code using VS Code and the Sentry Python SDK.

From Dev to Prod: Debugging in Next.js
Debugging. It’s a critical skill for all developers. And when you’re building a dynamic, high-performance application with Next.js, Chrome DevTools, and console.log() aren’t always enough. There are more effective and structured ways to debug Next.js apps as they scale. You will also find practical tips from our Next.js debugging workshop sprinkled throughout. Also, while this guide is focused primarily on Next.js, there is a similar guide for debugging React apps here.
How to Transition from nRF5 SDK to Zephyr NCS Lessons from Ultrahuman's Journey
At Ultrahuman, innovation is at the core of everything we do. Our health devices, powered by the nRF52840 SoC for BLE functionality, rely on Nordic Semiconductor’s renowned wireless technology. For years, the nRF5 SDK was the cornerstone of firmware development for these chipsets, but in 2018, Nordic introduced the nRF-Connect SDK(NCS), built on Zephyr RTOS, signaling a new era for BLE applications.

Debug Faster & Smarter with Session Replay
As developers, we know that debugging can be a time-consuming process. Hunting down elusive bugs or trying to reproduce an issue based on vague user reports can turn a simple fix into an hours-long journey. While leveraging logs, metrics, and tracing to reproduce locally or try to understand what happened can help us identify a root case, we’re often missing a critical component to truly being able to understand the impact on our users.

Lightrun AI Autonomous Debugger
This video showcases how with Lightrun developer observability platform, developers can leverage the AI debugger within the platform plugin to swiftly identify critical code level issues through automated hypothesis and insertion of debugging actions at runtime (Lightrun dynamic logs, virtual breakpoints (Snapshots) and more. That helps reduce MTTR to mere minutes.