Operations | Monitoring | ITSM | DevOps | Cloud




Importance of System Resource Monitoring on Graylog, Elasticsearch, and MongoDB Servers
The first thing we tell Graylog users is, “Monitor your disk space.” The core set of metrics discussed below should always be in acceptable parameters and never grow over extended periods without going back to normal levels. This is why it is critical to monitor metrics that come directly from the hosts running your Graylog infrastructure.

Announcing Graylog Illuminate for Authentication
Graylog Illuminate for authentication is a brand new offering designed by our Enterprise Intelligence team. It eliminates the manual setup necessary to detect, monitor, and analyze authentication activities and issues across your IT infrastructure by providing pre-built Dashboards, Alerts, and data enrichment. Initially, Graylog Illuminate for Authentication will address Windows authentication issues and activities. We will release additional data sources in the coming weeks so stay tuned!
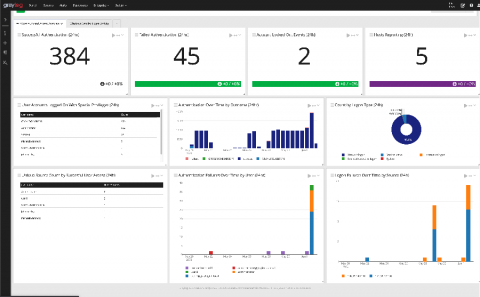
Graylog Illuminate: The Story
Graylog is an advanced log management system, capable of ingesting all of your corporate logs into a central repository for easy searching and analysis of your data.
Announcing Graylog v3.3
Today we are officially releasing Graylog v3.3 This release includes enhancements to search, events, and alerts that introduce greater efficiencies to your daily log management efforts and strengthen your audit and compliance capabilities. Please read on for detailed descriptions of each feature.
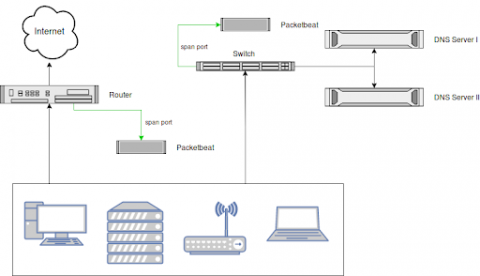
Security Log Monitoring and DNS Request Analysis
Monitoring all DNS requests in your network, including those that were blocked by (e.g., by a firewall) is a great way to increase visibility, enforce compliance and detect threats. A common problem with collecting DNS logs is that DNS server logs are notoriously hard to parse. Also, parsing only the logs of your DNS servers leaves a blind spot when it comes to usage of, or the attempt to use, an external DNS server like Google's 8.8.8.8.

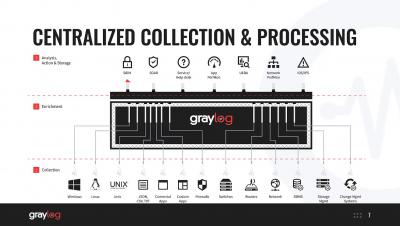
Tech Talk 3 Monitoring for Insider Threats

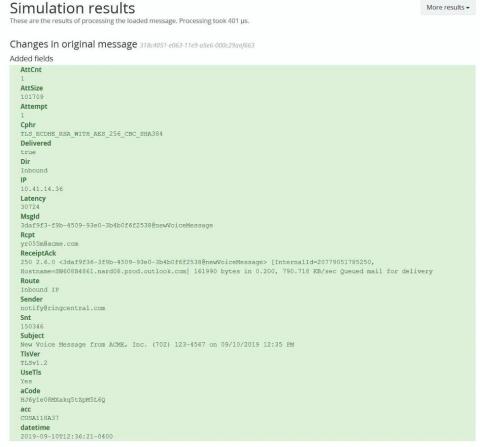
Key Value Parser Delivers Useful Information Fast
Parsers make it easier to dig deep into your data to get every byte of useful information you need to support the business. They tell Graylog how to decode the log messages that come in from a source, which is anything in your infrastructure that generates log messages (e.g., a router, switch, web firewall, security device, Linux server, windows server, an application, telephone system and so on).