Operations | Monitoring | ITSM | DevOps | Cloud

Latest Videos

Release 1.38.0 - DBENGINE v2, Functions, Events, Notifications, Role Based Access, and much more!

The Netdata team is very excited to introduce you to all the new features and improvements in the new version. HIGHLIGHTS: DBENGINE v2 The new open-source database engine for Netdata Agents, offering huge performance, scalability and stability improvements, with a fraction of memory footprint! FUNCTION: Processes Netdata beyond metrics! We added the ability for runtime functions, that can be implemented by any data collection plugin, to offer unlimited visibility to anything, even not-metrics, that can be valuable while troubleshooting.

Release 1.37.0: Infinite scalability, database tiering, and much more

Another release of the Netdata Monitoring solution is here! We focused on these key areas: IMPORTANT NOTICE This release fixes two security issues, one in streaming authorization and another at the execution of alarm notification commands. All users are advised to update to this version or any later!

How to monitor server load

We often hear the term "load" used to describe the state of a server or a device. But what does it really mean? System load is a measure of the amount of computational work that a system performs. An overloaded system, by definition, isn't able to complete all its tasks per schedule - this affects the performance and productivity of the system. And while "load" often gets conflated with CPU usage there's a lot more to it.

PostgreSQL Monitoring Upgrade

Netdata for PostgreSQL monitoring just got a huge upgrade, collecting 100+ PostgreSQL metrics and displaying these across 60+ different composite charts. You can check the reference documentation for the full list of metrics, and see them running live in the demo space. If you are using PostgreSQL in production, it is crucial that you monitor it for potential issues. And the more comprehensive the monitoring the better!

How Netdata's machine learning works

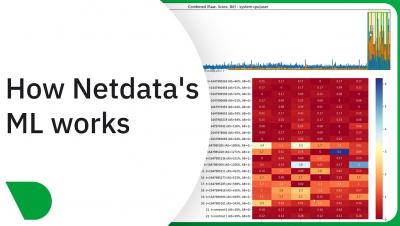
In this video we will walk though the Netdata Anomaly Advisor deepdive python notebook. The aim of this notebook is to explain, in detail, how the unsupervised anomaly detection in the Netdata agent actually works under the hood. No buzzwords, no magic, no mystery :) Try it for yourself, get started by signing in to Netdata and connecting a node. Once initial models have been trained (usually after the agent has about one hour of data, zero configuration needed), you'll be able to start exploring in the Anomaly Advisor tab of Netdata.