Learn how LBAC for metrics data sources, a feature in Grafana 11.6, allows fine-grained access control to data sources by filtering metrics based on labels.
From Grafana 12 and k6 1.0 to our inaugural Science Fair and a "Night at the Museum" reception, the GrafanaCON 2025 agenda includes a lot to be excited about.
The Grafana Labs 3rd annual Observability Survey has landed and we're excited to launch a limited video series that breaks down the findings from over 1200 observability practitioners and leaders around the world. In this video, CTO Tom Wilkie breaks down the 4 biggest trends shaping observability in 2025 across open source, executive buy-in, AI, and cost vs. value. Stay tuned for more video explainers!
Text box variables let users type whatever they want -- great for text filtering and searching! In this video we'll look at how to use text box variables in Grafana dashboards. Grafana Cloud is the easiest way to get started with Grafana dashboards, metrics, logs, and traces. Our forever-free tier includes access to 10k metrics, 50GB logs, 50GB traces and more. We also have plans for every use case.
Watch a deep-dive demo of Grafana k6 Studio, an open source desktop application that helps you create k6 test scripts quickly and easily via a visual interface.
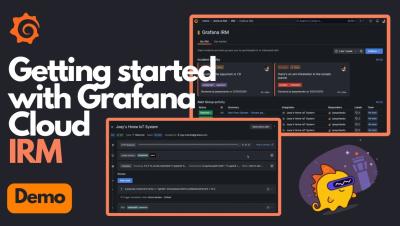
In this video, Joey Orlando, Engineering Manager at Grafana, walks you through Grafana Cloud Incident Response Management (IRM)—a new powerful solution that unifies Grafana OnCall and Grafana Incidents into one seamless experience. You'll learn how to: Set up on-call schedules and escalation chains Configure integrations for your monitoring systems Respond to alerts efficiently with automated workflows Migrate from PagerDuty or Splunk On-Call to Grafana IRM.
Learn how to gain real-time visibility into your web applications with Grafana Faro! In this hands-on tutorial, we’ll walk through instrumenting a JavaScript app with Faro.
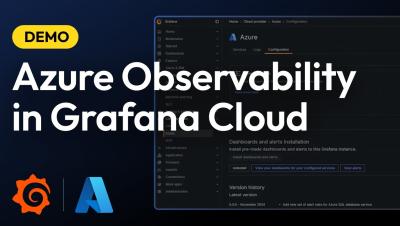
Microsoft Azure Cloud monitoring has never been more streamlined! In this video, Vasil Kaftandzhiev, Product Manager for Cloud Provider Observability in Grafana Cloud, walks you through how easy it is to monitor Azure Cloud Services with Grafana. With out-of-the-box dashboards, you can instantly visualize key metrics for essential Azure services like: API Gateway Queue Storage Virtual Machines Log Storage Events Hub Network Load Balancers SQL.
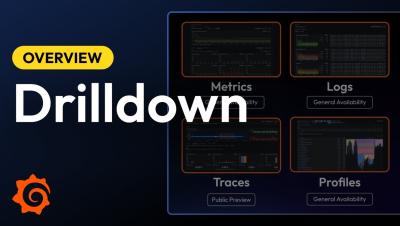
See how we're improving the apps to help you quickly get insights into your logs, metrics, traces, and profiles, and find out why we changed the name from Explore apps to Drilldown. Grafana Cloud is the easiest way to get started with Grafana dashboards, metrics, logs, and traces. Our forever-free tier includes access to 10k metrics, 50GB logs, 50GB traces and more. We also have plans for every use case.
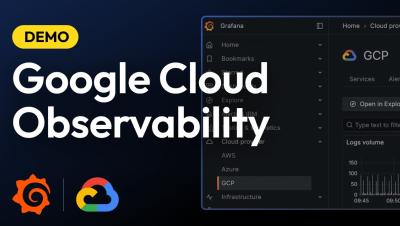
Want to monitor your Google Cloud infrastructure more effectively? Join Vasil Kaftandzhiev as he introduces Grafana Cloud’s new application designed specifically for Google Cloud observability. In this video, you'll discover how to: Optimize and troubleshoot your Google Cloud services Leverage out-of-the-box dashboards with key metrics and thresholds Set up comprehensive alerting for real-time incident response Streamline log management with an all-in-one logs view for faster root cause analysis Configure logs and metrics effortlessly using Grafana Alloy.